The Bottom Line: Green bond funds reverse course in July 2022 while green bond volumes are are expected to benefit from the Inflation Reduction Act.
July Summary
- Assets attributable to green bond funds, a segment consisting of four mutual funds and three ETFs, reversed a four-month decline in net assets largely due to capital depreciation. The seven funds added $30.7 million in net assets during the month of July, benefiting from an average total return gain of 2.98%, to end the month at $1,453.4 million. Refer to Chart 1. Still, green bond funds sustained estimated cash outflows in the amount of $7.1 million. However, these were offset by market appreciation. The largest net gainers were also the two largest funds in the category. Included is the $810.5 million Calvert Green Bond Fund. The fund gained $22.1 million, 89% of which was attributable to the institutional share class I (CGBIX) that accounts for 86% of the fund’s assets. Also, the $ 269.1 million iShares USD Green Bond ETF (BGRN) added $5.1 million. The fund’s total return performance results have shown improvement since its mandate was updated as of March 1 of this year to limit its exposure to US dollar denominated green bonds. The only fund to experience a net decline in assets was the recently relaunched $111 million Franklin Municipal Green Bond EFT (FLMB) that gave up $2.6 million (net).
- After the first two quarters of 2022 recorded the worst US bond market returns since 1980 on the back of significant increases in US interest rates, July delivered a positive beginning for the third quarter and offered investors some relief from year-to-date and trailing 12-month declines. The US bond market returned 2.44%, according to the Bloomberg US Aggregate Bond Index while the global bond market returned 2.13% per the Bloomberg Global Aggregate Bond Index. At the same time, green bond funds posted an average gain of 2.98% in July, a strong rebound but still not sufficient to wipe away paper losses that stood at -8.97% since the start of the year and -10.29% over the trailing 12-month interval to July 31. The $38.9 million Mirova Global Green Bond Fund Y (MGGYX) led with a positive 4.55% total return while at the other end of the range, the $82.6 million VanEck Green Bond ETF (GRNB) posted a gain of 2.04%. Refer to Table 1.
- Based on preliminary data, $12.3 billion in green bonds were issued in July, compared to $25.6 billion issued during the same month in 2021 and $47 billion that came to market last month. Refr to Chart 2. Green bond issuance lagged in Q1 but revived in the second quarter. Still, based on updated data, green bond volumes year-to-date reached $243.0 billion versus last year’s $269.4, a decline of 26.4 million or 10%. The drop in volumes is not unique to green bonds, as heightened market volatility and rising interest rates during the first quarter extended through the full first half of the year as inflation stress was joined by rising recession risks. The growing headwinds have all contributed to slowdowns and contractions in the second-quarter bond issuance for every sector relative to the first quarter, which is expected to keep global bond issuance in 2022 well below last year’s levels.
- Toward the end of July news emerged of negotiations between Senate Majority Leader Chuck Schumer and West Virginia Senator Joe Manchin regarding a new budget reconciliation bill, the Inflation Reduction Act (IRA), that included $369 billion in energy security and climate spending over the next 10 years as well as tax and healthcare provisions. From that point, the passage of the IRA moved very quickly. It successfully passed through the Senate on August 7, the House of Representative on August 12 and IRA was signed into law by President Joe Biden on August 16. The Act is a major piece of legislation that does more to cut fossil fuel use and fight climate change than any previous legislation in the US. It evidences the U.S.’s commitment to reducing its emission profile and it is likely to stimulate green bond issuance in the US. The main thrust of the bill is the $369 billion provision toward clean energy assets and technologies over the next decade. The IRA provides tax credits reducing the cost to deploy new wind and solar assets, acquire new electric and hybrid vehicles, and invest in renewables and clean energy technologies, including clean hydrogen production and carbon capture and storage (CCS). According to the Rhodium Group, these provisions are likely to reduce carbon emissions 37% to 41% below 2005 levels by 2030.
Chart 1: Green bond mutual funds and ETFs and assets under management – August 2021 – July 31, 2022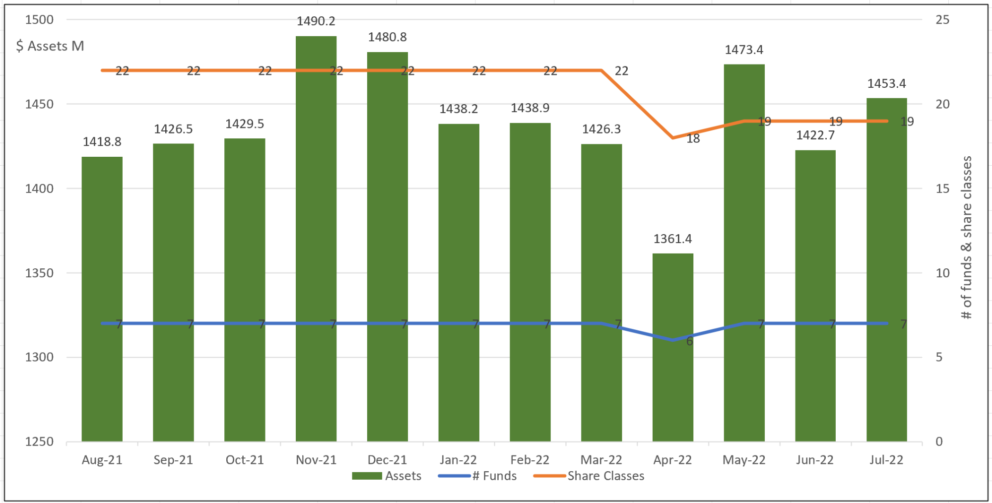 Notes of Explanation: Franklin Municipal Green Blond Fund and tis four share classes with total net assets of $9.7 million included in the data. At the same time, the rebranded Franklin Liberty Federal Tax-Free Bond ETF renamed the Franklin Municipal Green Bond ETF is excluded as of April 29, 2022. Fund total net assets data source: Morningstar Direct; fund filings. Research and analysis by Sustainable Research and analysis LLC
Chart 2: Issuance of green bonds: January 1, 2021 – July 31, 2022 Notes of Explanation: Volumes data varies by data source and may be preliminary. Source: Climate Bond Initiative (CBI)
Table 1: Green bond funds: Performance results, AUM and expense ratios-July 31, 2022
Name | Symbol | 1-Month Return (%) | 3-Month Return (%) | Y-T-D Return (%) | 12-M Return (%) | 3-Year Average Return (%) | $Assets (millions) | Expense Ratio (%) |
Calvert Green Bond A* | CGAFX | 2.82 | 0.26 | -8.5 | -10.06 | -0.84 | 76 | 0.73 |
Calvert Green Bond I* | CGBIX | 2.76 | 0.24 | -8.43 | -9.9 | -0.62 | 715.5 | 0.48 |
Calvert Green Bond R6* | CBGRX | 2.75 | 0.25 | -8.4 | -9.85 | -0.57 | 41.1 | 0.43 |
Franklin Municipal Green Bond ETF$ | FLMB | 3.32 | 108.4 | 0.3 | ||||
iShares USD Green Bond ETF^ | BGRN | 2.11 | 0.78 | -9.34^ | -11.17^ | -1.93^ | 274.2 | 0.2 |
Mirova Global Green Bond A* | MGGAX | 4.44 | -1.11 | -10.5 | -12.29 | -2.2 | 6.5 | 0.94 |
Mirova Global Green Bond N* | MGGNX | 4.54 | -0.99 | -10.31 | -12.04 | -1.91 | 4.8 | 0.64 |
Mirova Global Green Bond Y* | MGGYX | 4.55 | -0.99 | -10.33 | -12 | -1.92 | 29.6 | 0.69 |
PIMCO Climate Bond A* | PCEBX | 3.28 | 0.12 | -8.43 | -9.56 | 0.8 | 0.91 | |
PIMCO Climate Bond C* | PCECX | 3.22 | -0.06 | -8.82 | -10.24 | 0 | 1.66 | |
PIMCO Climate Bond I-2* | PCEPX | 3.31 | 0.2 | -8.27 | -9.29 | 0.5 | 0.61 | |
PIMCO Climate Bond I-3* | PCEWX | 3.3 | 0.18 | -8.3 | -9.33 | 0.1 | 0.66 | |
PIMCO Climate Bond Institutional* | PCEIX | 3.32 | 0.22 | -8.22 | -9.2 | 11.4 | 0.51 | |
TIAA-CREF Green Bond Advisor | TGRKX | 2.17 | 0.21 | -8.87 | -9.81 | 0.04 | 3.1 | 0.6 |
TIAA-CREF Green Bond Institutional* | TGRNX | 2.17 | 0.22 | -8.85 | -9.79 | 0.06 | 74.5 | 0.45 |
TIAA-CREF Green Bond Premier* | TGRLX | 2.16 | 0.18 | -8.93 | -9.92 | -0.07 | 1 | 0.6 |
TIAA-CREF Green Bond Retail* | TGROX | 2.16 | 0.15 | -9 | -10.04 | -0.22 | 7.2 | 0.8 |
TIAA-CREF Green Bond Retirement* | TGRMX | 2.16 | 0.17 | -8.93 | -9.92 | -0.07 | 14.6 | 0.7 |
GRNB | 2.04 | 0.21 | -8.99 | -10.8 | -1.24^ | 84.1 | 0.2 | |
Average/Total | 2.98 | 0.01 | -8.97 | -10.29 | -0.88 | 1,422.7 | 0.64 | |
Bloomberg US Aggregate Bond Index | 2.44 | 1.49 | -8.16 | -9.12 | -0.63 | |||
Bloomberg Global Aggregate Bond Index | 2.13 | -0.88 | -12.08 | -14.58 | -2.45 | |||
Bloomberg Municipal Total Return Index | 2.64 | 2.46 | -6.58 | -6.93 | 0.43 | |||
S&P Green Bond US Dollar Select IX | 1.98 | 0.1 | -9.17 | -10.77 | -0.58 | |||
ICE BofAML Green Bond Index Hedged US Index | 4.47 | 0.15 | -9.78 | -11.46 | -1.84 |
Notes of Explanation: Blank cells=NA. 3 and 5-year returns are average annual total returns. *Fund invests in foreign currency bonds and performance should also be compared to a more narrowly based relevant index such as the ICE BofAML Green Blond Index Hedged US or equivalent. ** Fund invests in US dollar denominated green bonds only and performance should also be compared to a more narrowly based relevant index such as the S&P Green Bond US Dollar Select Index or equivalent. ^Effective March 1, 2022, BGRN fund shifted to US dollar green bonds while GRNB made a similar shift as of September 1, 2019. $Effective May 3, 2022, Franklin Templeton rebranded the Franklin Liberty Federal Tax-Free Bond ETF. Fund total net assets and performance data source: Morningstar Direct; fund filings. Research and analysis by Sustainable Research and Analysis LLC