Last week BlackRock announced the launch of two fixed income ETFs, the iShares ESG USD Corporate Bond ETF (SUSC) and the iShares ESG 1-5 Year USD Corporate Bond ETF (SUSB). These are intended to track fixed income indexes designed to deliver similar risk and return characteristics as the traditional benchmarks but further qualified on the basis of constituent environmental, social and governance (ESG) scores while at the same time excluding certain companies from consideration. While not equivalent to a broad-based U.S. focused fixed income benchmark, such as the widely followed Bloomberg Barclays Aggregate Bond Index, these are the first of their kind passively managed fixed income ESG ETFs which are not even available as yet in the form of mutual funds. Just as significantly, the two ETFs are offered at the lowest expense ratios relative to other sustainable ETFs. The addition of these two fixed income ETFs brings to three the number of sustainable fixed income ESG oriented ETFs, with the first consisting of a green bond index ETF launched by VanEck in January of this year. The two new ETFs expand the roster of what is now a universe of 50 sustainable ETFs that have attracted a total of $5.6 billion in net assets as of June 30, 2017.
The BlackRock iShares Index ESG Fixed Income ETFs
The first fund, the iShares ESG USD Corporate Bond ETF (SUSC), seeks to track the investment results of the Bloomberg Barclays MSCI US Corporate ESG Focus Index which, in turn, is designed to capture the performance of U.S. dollar-denominated, investment-grade fixed rate and taxable corporate bonds that have remaining maturities of greater than or equal to one year issued by companies that have positive ESG characteristics while exhibiting risk and return characteristics similar to those of the Bloomberg Barclays US Corporate Index. As of May 31, 2017, the index included 2,297 issues from the following countries: Australia, Bermuda, Brazil, Canada, the Cayman Islands, Chile, Colombia, Curacao, France, Guernsey, Ireland, Isle of Man, Italy, Japan, Jersey, Luxembourg, Mexico, the Netherlands, Singapore, Spain, Sweden, Switzerland, the United Kingdom, and the United States. A significant portion of the index consists of securities of financials and industrials companies. These had an average maturity of 7.15 years and the average credit rating was BBB+.
The second ETF, the iShares ESG 1-5 Year USD Corporate Bond ETF (SUSB), seeks to track the investment results of the Bloomberg Barclays MSCI US Corporate 1-5 Year ESG Focus Index that, in turn, is designed to reflect the performance of U.S. dollar-denominated, investment-grade corporate bonds with remaining maturities between one and five years and issued by companies that have positive ESG characteristics, while exhibiting risk and return characteristics similar to those of the Bloomberg Barclays US Corporate 1-5 Years Index. As of May 31, 2017, the index included 543 issuers with an average maturity of 2.74 years and an average credit rating of A-. A significant portion of the index is represented by securities of financials and industrial companies from the following countries: Australia, Canada, the Cayman Islands, Chile, Colombia, Curacao, France, Germany, Ireland, Italy, Japan, Luxembourg, Mexico, the Netherlands, Singapore, Spain, Sweden, Switzerland, the United Kingdom, and the United States.
Exclusions and ESG considerations
The two aforementioned indexes were developed by Bloomberg Barclays Capital Inc. with environmental, social and governance-related inputs provided by MSCI ESG Research LLC. The starting point for the construction of these indexes is the exclusion of securities of companies involved in the business of tobacco and controversial weapons companies, as well as securities of companies involved in very severe business controversies (as determined by MSCI ESG Research). Once these companies have been isolated, a quantitative process is applied to determine optimal weights for securities to maximize exposure to securities of companies with higher ESG ratings, subject to maintaining risk and return characteristics that are similar to the basic index.
Ready To Gain A Competitive Edge? In-depth sustainable investment management analysis, research, opinions and sustainable fund ratings
For each industry, MSCI ESG Research identifies key ESG issues that can lead to substantial costs or opportunities for companies (e.g., climate change, resource scarcity, demographic shifts). MSCI ESG Research then rates each company’s exposure to each key issue based on the company’s business segment and geographic risk and analyzes the extent to which companies have developed robust strategies and programs to manage ESG risks and opportunities. MSCI ESG Research scores companies based on both their risk exposure and risk management. To score well on a key issue, MSCI ESG Research assesses management practices, management performance (through demonstrated track record and other quantitative performance indicators), governance structures, and/or implications in controversies, which all may be taken as a proxy for overall management quality. Controversies, including, among other things, issues involving anti-competitive practices, toxic emissions and waste, and health and safety, occurring within the last three years, lead to a deduction from the overall management score on each issue. Using a sector-specific key issue weighting model, companies are rated and ranked in comparison to their industry peers. Key issues and weights are reviewed at the end of each calendar year while corporate governance is always weighted and analyzed for all companies.
The Universe of Sustainable Exchange Traded Funds
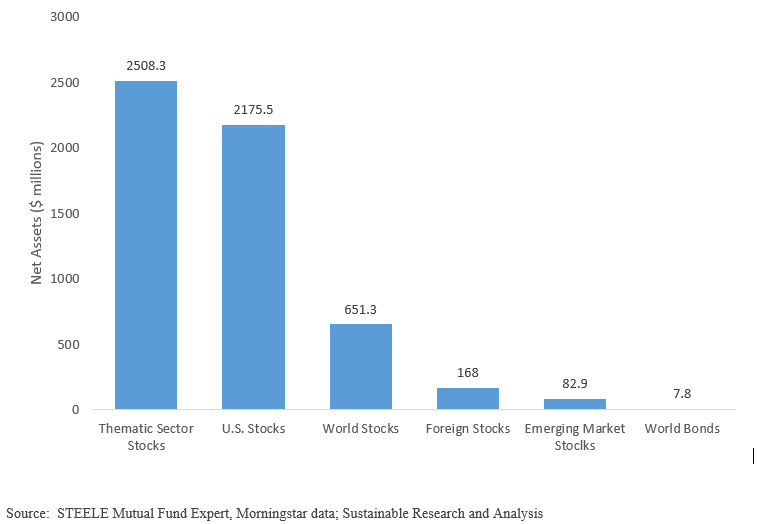
As of June 30, 2017, a total of 50 ETFs pursuing sustainable strategies are listed on various exchanges and available to sustainable investors as well as other investors. These include 49 equity oriented ETFs and, until the introduction of the latest two funds, just one fixed income ETF that collectively pursue sustainable strategies ranging from exclusions of companies and sectors, to ESG integration, impact strategies as well as thematic orientations or sector themes, such as investments in water, solar, energy and wind energy. Some ETFs employ one of more of these strategies and their geographic focus may be limited to U.S. based companies or these may extend beyond the U.S. to encompass developed and developing countries in Europe, Asia and Latin America. Refer to Chart 1 for a breakdown of these ETFs by traditional category along with assets under management. At 20 offerings, ETFs focused on thematic sector investments are the largest in number. A total of 15 ETFs provide stock exposure to large capitalization, mid-cap and small-cap stocks in the U.S. while a total of 7 ETFs provide exposure to world stocks qualified on the basis of sustainable strategies.
Chart 1: Sustainable ETFs by Traditional Investment Categories and Net Assets

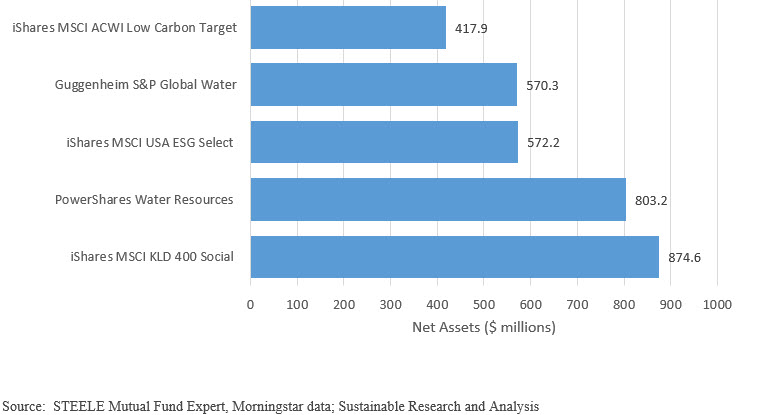
Even with these many ETFs, the sustainable ETF segment is highly concentrated, with only five ETFs accounting for 57% of net assets. Refer to Chart 2.
Chart 2: Five Largest Sustainable ETFs as of June 30, 2017

Sustainable ESG Funds Feature Higher Than Average Expense Ratios
Along with their sustainable strategies, what further distinguishes the two newly launched BlackRock ETFs and qualifies these as particularly compelling offerings for investors are their very attractive expense ratios. According to our analysis, the expense ratios of both funds fall into the lowest tier. The iShares ESG USD Corporate Bond ETF (SUSC) and the iShares ESG 1-5 Year USD Corporate Bond ETF (SUSB) are subject to expense ratios of 0.12% or 12 bps and 0.18% or 18 bps, respectively. These rank within the lowest or first quartile of expense ratios within the universe of 50 ETFs. For further information on the methodology used to stratify expense ratios, refer to the article Stratifying Expense Ratios: An Explanation.
In general, the universe of sustainable ETFs charges high average and median expense ratios of 0.48% and 0.46% or 46 bps, respectively. In fact, only 20 funds fall within the lowest expense ratio segment whose charges run as low as 0.20% or 20 bps. At the other end of the range, expense ratios are as high as 0.95%–a level that is exceedingly high for passively manage fund offerings.


