The Bottom Line: Enhanced disclosures to clients and shareholders by self-described sustainable mutual funds and ETFs of ESG related outcomes and impacts are not commonplace.
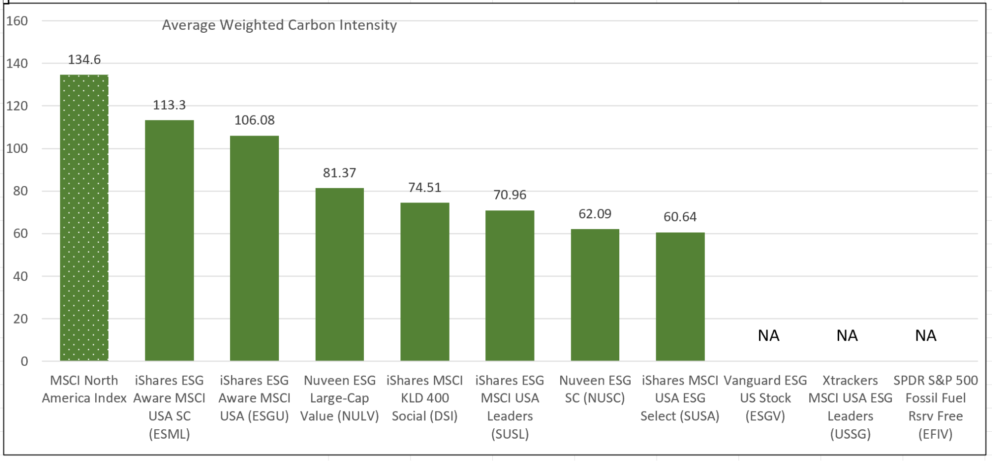
Average weighted carbon intensity metrics for the largest 10 sustainable ETFs Note of Explanation: Data sources: Fund Fact Sheets, MSCI, Sustainable Research and Analysis LLC.
Observations:
- In general, enhanced disclosures of ESG related outcomes and impacts by sustainable funds to clients and shareholders are not commonplace. On the one hand, sustainable funds in the US are not subject to any ESG-specific regulatory requirements to provide such information, and recently proposed SEC enhanced disclosure practices are still far from being finalized and adopted. On the other hand, as we see it, funds integrating one or more sustainable factors that represent a significant or main consideration in investment decision making and that have served as a magnet for attracting client assets have a duty and responsibility to step up their disclosures and report on specific and measurable environmental, social and governance outcomes. Excluded are funds that consider ESG factors alongside other, non-ESG factors in investment decisions¹.
- Except for BlackRock which has published individual sustainability reports for its universe of sustainable iShares ETFs, most sustainable ETFs (and mutual funds) do not explicitly report to investors on non-financial ESG-oriented outcomes in the form of key performance indicators (KPIs) or otherwise. This contrasts with fundamental data such as price-to-book ratios, price-to-earnings ratios, or dividend yields, to mention just a few, that regularly appear in various shareholder communications.
- For investors seeking to understand, measure and manage carbon risk in particular, some funds are now disclosing a portfolio’s weighted average carbon intensity. A portfolio’s weighted average carbon intensity is derived by calculating the carbon intensity for each portfolio company (comprised of Scope 1 + Scope 2 emissions per $million in sales) and calculating the weighted average by portfolio weight. GHG emissions are expressed in tons of GHG, which can be equated to greenhouse gas emissions released for 1-mile of travel in an automobile that gets 25 miles/gallon. Weighted average carbon intensity, which is one of two GHG metrics proposed by the SEC in its disclosure proposal for funds that consider GHG emissions, allows for comparisons between funds of different sizes.
- Often disclosed in a fund’s Fact Sheet, carbon intensity data is now disclosed by seven of the top 10 diversified US-equity ETFs. These funds, all index managed stock funds, have attracted $47.9 billion in net assets and account for 43% of sustainable ETF assets under management of 232 funds with $110.3 billion. Average weighted carbon intensity outcomes across the range of the top 10 diversified US-equity ETFs as of May 31, 2022 range from a high of 113.3 reported by the iShares ESG Aware MSCI USA Small-Cap ETF (ESML) to a low of 60.64 registered by the Nuveen ESG Small-Cap ETF (NUSC). This compares, for example, to a carbon intensity of 134.6 calculated for the MSCI North America Index²,or between 16% and 55% higher across the reporting ETFs. While the calculation methodologies are the same, because they track two different benchmarks, the two small cap ETFs, the iShares ESG Aware MSCI USA Small Cap ETF (ESML) and Nuveen ESG Small Cap ETF (NUSC) produce widely different results that investors should take on board when making investment decisions qualified by their investment preferences.
¹Such funds should disclose their ESG integration practices but have a lesser duty to disclose outcomes. ²Based on latest reported MSCI data as of October 29, 2021. Carbon intensity for a small cap index is not available.


