Observations:
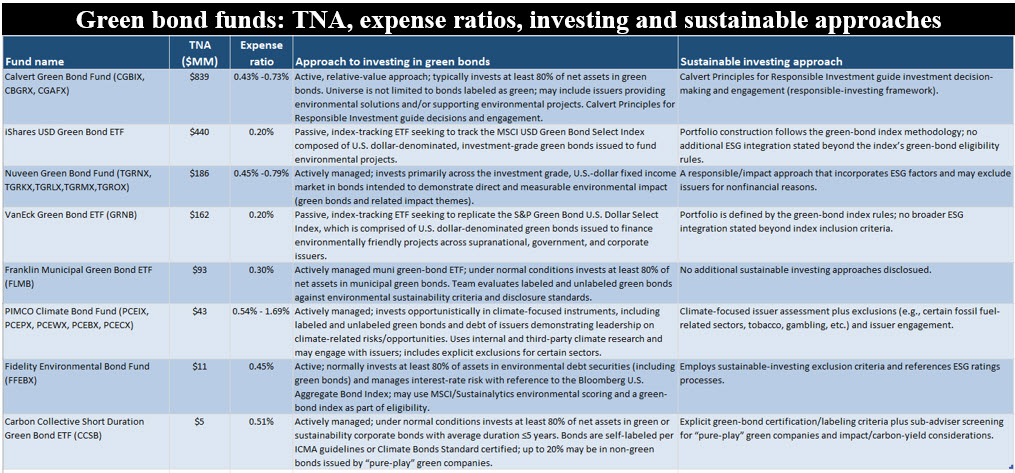
• The small segment of eight thematic green bond funds/18 share classes and ETFs expanded its base of assets in 2025, driven by market appreciation and net positive flows to reach $1.8 billion at year-end. This, even as two green bond funds managed by Lord Abbett and Mirova (combined assets of $44 million at year-end 2024) liquidated their funds during the year.
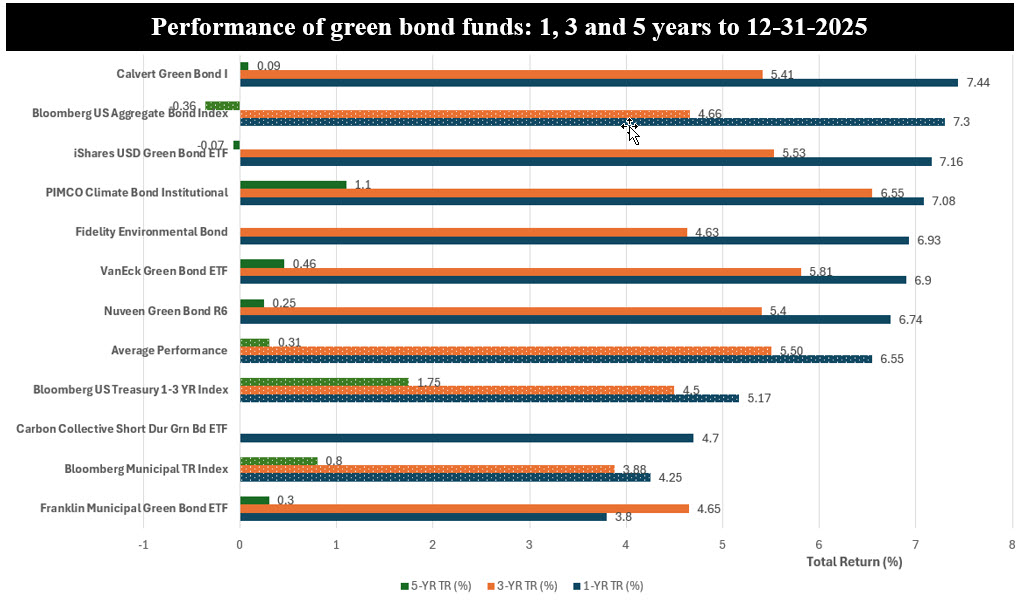
• Aggregate performance, up an average of 6.5% in 2025, combines the results achieved by funds that invest in either US dollar denominated issues, both US and non-US dollar denominated issues, municipal green bonds or short duration bonds. When harmonized by excluding the performance of the Franklin Municipal Green Bond ETF and Carbon Collective Short Duration Green Bond ETF, the average results for the segment ticks up to 6.8% for 2025. Over the trailing three-and five-year time intervals, the same segment posted average annual returns of 5.56% and 0.31%–both in excess of the 4.66% and -0.36% recorded by the Bloomberg US Aggregate Bond Index.
• 2025 was a volatile year. In fixed income, 2025 marked the best year of the last five years for “plain-vanilla” core bonds. The Bloomberg U.S. Aggregate Bond Index returned 7.3% on a total return basis, supported by the Fed’s 75 bps of easing and a decline in intermediate and long-term yields as the 10-year Treasury yield fell by 40 bps to 4.2% at the end of December. Credit also held up. The Bloomberg US Corporate Aaa Index gained 6.38% while high yield corporates added 8.62%, reflecting resilient growth and historically tight spreads. Against this backdrop, green bond funds still posted attractive results. The best performing fund in 2025, and also the largest and oldest fund in the segment, is the $839.1 million Calvert Green Bond Fund I shares. The fund, which benefited from its slightly longer durations and single A average credit quality, posted a gain of 7.44%. The fund’s two other share classes posted returns of 7.41% (Class R6) and 7.18% (Class A).
• Green bond funds are investment vehicles consisting of active and passively managed mutual funds and ETFs that pool money to invest exclusively in debt securities issued specifically for the purpose of financing environmental or climate-friendly projects. These funds support initiatives like renewable energy, energy efficiency, clean transport, and sustainable water management. They have been offering investors competitive financial returns with lower risk profiles (standard deviation of monthly returns) while supporting the transition to a low-carbon economy. See table below. In every other respect, green bonds are the same as conventional bonds. Either individually or in the form of funds, these instruments can offer a thematic complement to core sustainable fixed income allocations.
• Investable opportunities for these funds continue to expand. The supply of green bonds in the U.S. increased in 2025, according to SIFMA data. Green bond volumes in the US reached $59.2 billion, up from $56 billion in 2024, or an increase of 5.6%. Globally, green bond issuance reached $539 billion while annual global renewable investments set new highs, even in the face of policy headwinds, having reached a record $2.3 trillion (which includes financings in the form of green bonds), according to Bloomberg BNEF. Further, according to BNEF’s baseline scenario, average annual investments in the transition could reach about $2.9 trillion over 2026–2030. At the same time, unlike mitigation and energy transition investments, adaptation finance is still comparatively small and tracked less comprehensively but is expected to rachet up considerably as the severity as well as frequency of climate events intensify and accelerate.