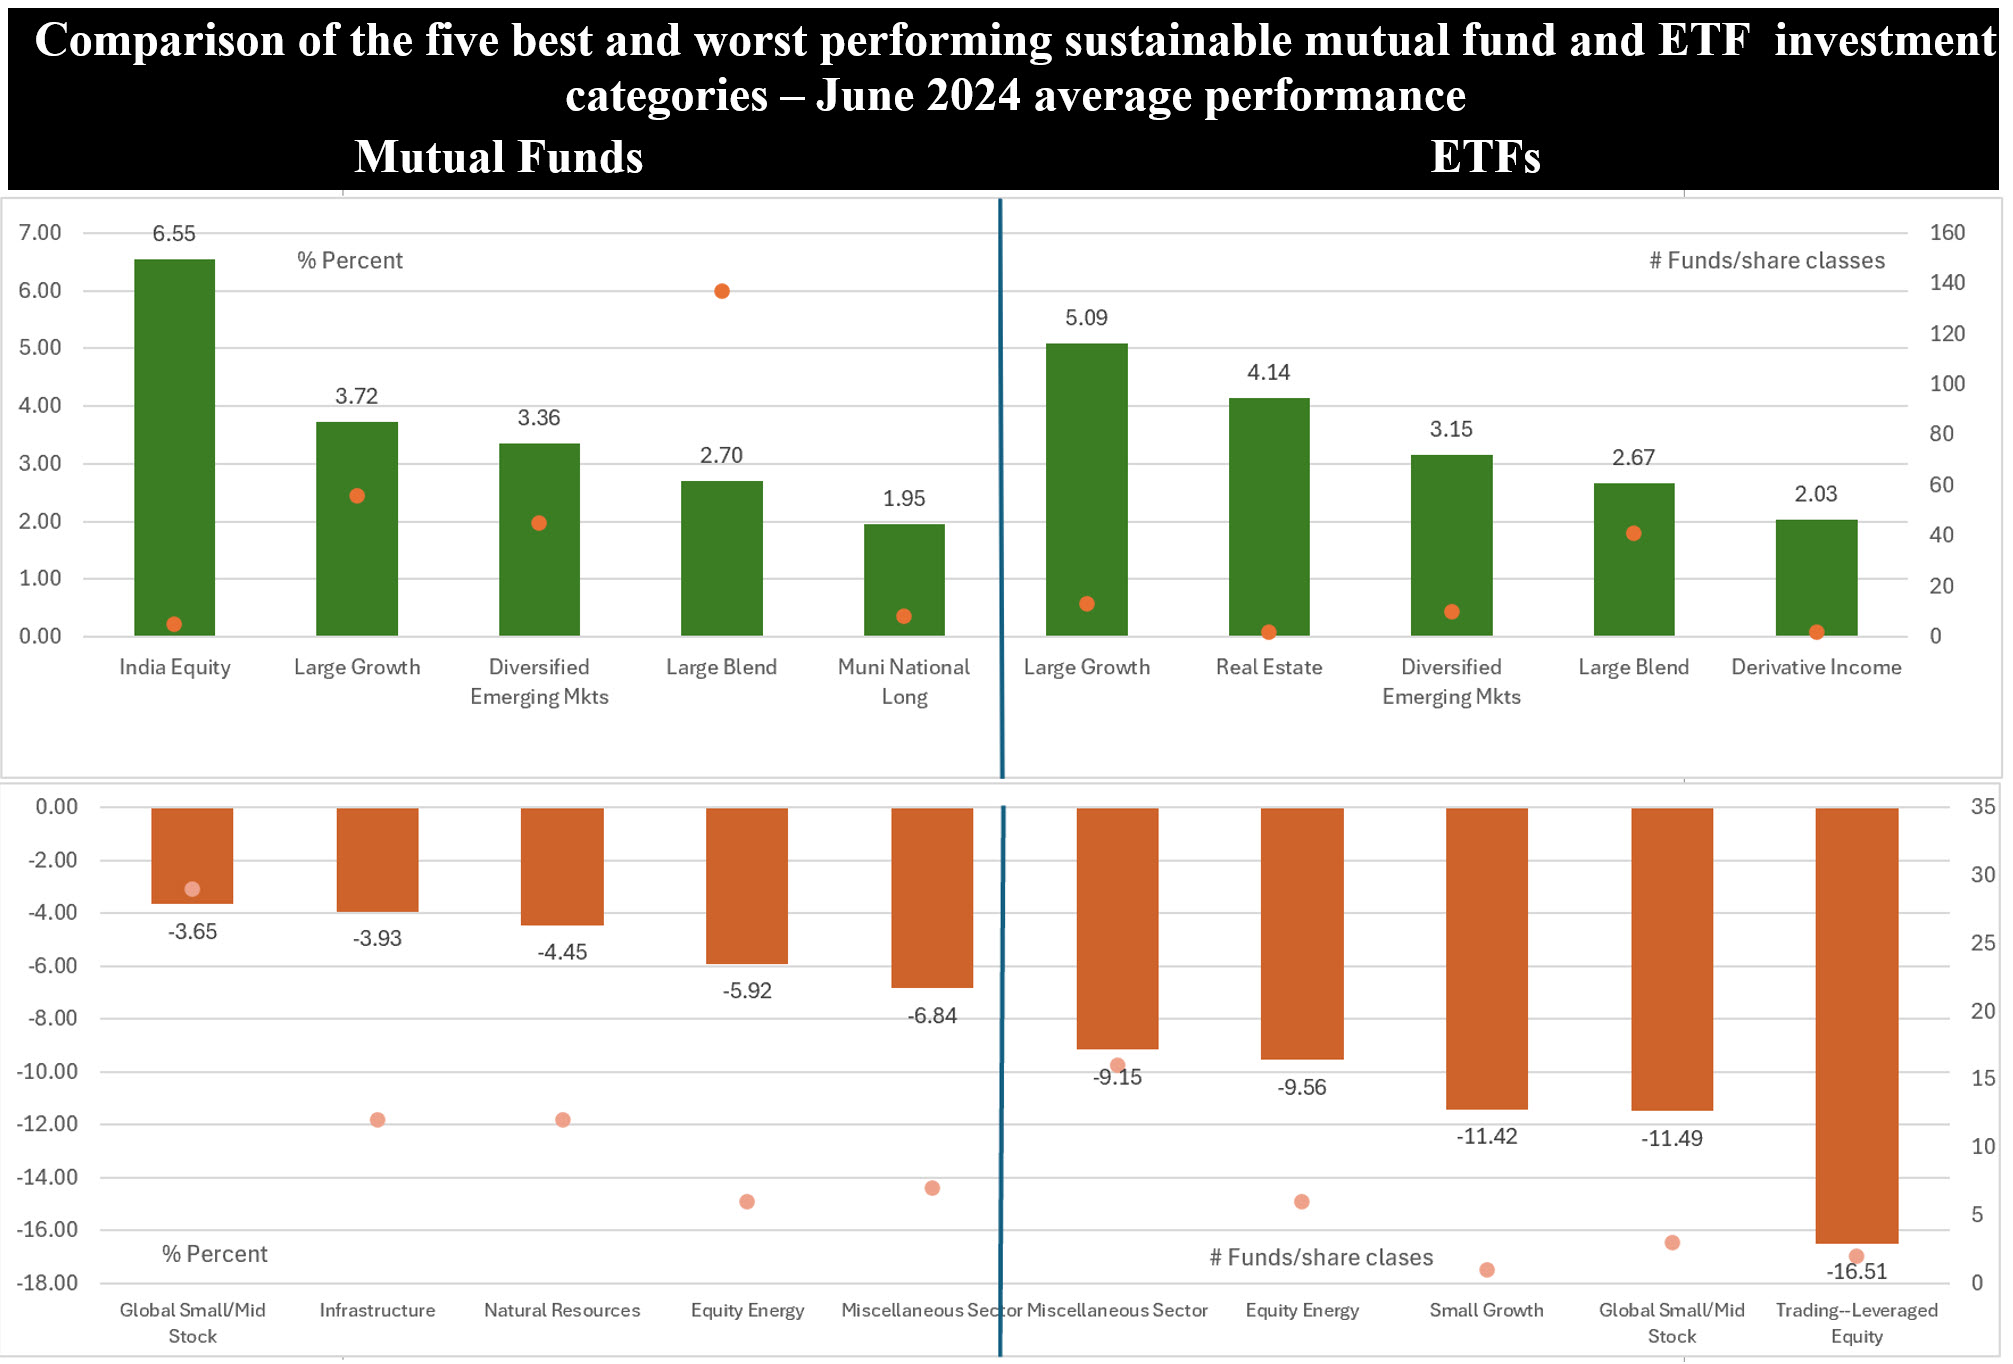
The Bottom Line: Comparisons between sustainable mutual funds and ETFs have to account for the variations in composition of the two investment company types.

Notes of explanation: Chart displays arithmetic average performance of the five best and worst performing sustainable mutual fund and ETF investment categories as of June 2024 and number of funds that make up each category. Sources: Morningstar Direct; Sustainable Research and Analysis LLC.
Observations:
• Focused sustainable long-term mutual funds and ETFs, a total of 1,454 funds/share classes, posted a combined average return of 0.47% in June and an average gain of 10.6% over the trailing twelve months.
• At the same time, the average performance results of mutual funds and ETFs diverged during these time intervals. Sustainable mutual funds recorded average gains in June and over the trailing twelve months of 0.8% and 11.6%, respectively. Comparable returns for ETFs were -1.2% and 5.4%, respectively. These variations diminish but are not eliminated when the results are recalculated on an asset weighted basis, with particular improvements in average asset weighted returns for ETFs.
• For sustainable fund investors considering investments in mutual funds and/or ETFs, these variations likely raise questions about the reasons behind the differences in average returns.
• When considering mutual funds versus ETFs, a more granular analysis is called for. That said, at least three overarching factors contributed to the differences in average returns. First, ETFs largely consist of passively managed, index tracking, funds versus mutual funds that are almost entirely actively managed. Second, sustainable mutual funds and ETFs vary as to the number of offerings and assets under management. The universe of sustainable mutual funds is comprised of 1,213 funds/share classes with total long-term net assets in the amount of $239.5 billion as of June 2024. This compares to 241 ETFs with $103.3 billion in total net assets. Third, the profile of the two sustainable investment company types also differ in terms of the number and composition of their fundamental investment categories. Mutual funds offer a more diversified menu of sustainable investment categories, extending to 64 categories, while ETFs provide investors with a more narrowly focused menu consisting of 45 investment categories. Of the 64 mutual fund investment categories, 21 categories, or 33%, registered negative returns that ranged from -0.19% to -6.84%. On the other hand, 21 of the 45 ETF investment categories, or 49%, recorded negative average returns. These ranged from -0.77% to a low of -16.51. This was particularly impactful in June when ETFs investing in small growth stocks, global small/mid cap stocks and leveraged equity portfolios posted one-month returns of -11.42%, -11.49% and -16.51%, respectively. These three categories, out of 45 fund categories, dragged down average returns while sustainable mutual funds had no exposure to these investment categories.


