The Bottom Line: Variations in the performance results by focused sustainable mutual funds and ETFs can be attributed to various factors that make comparisons difficult.

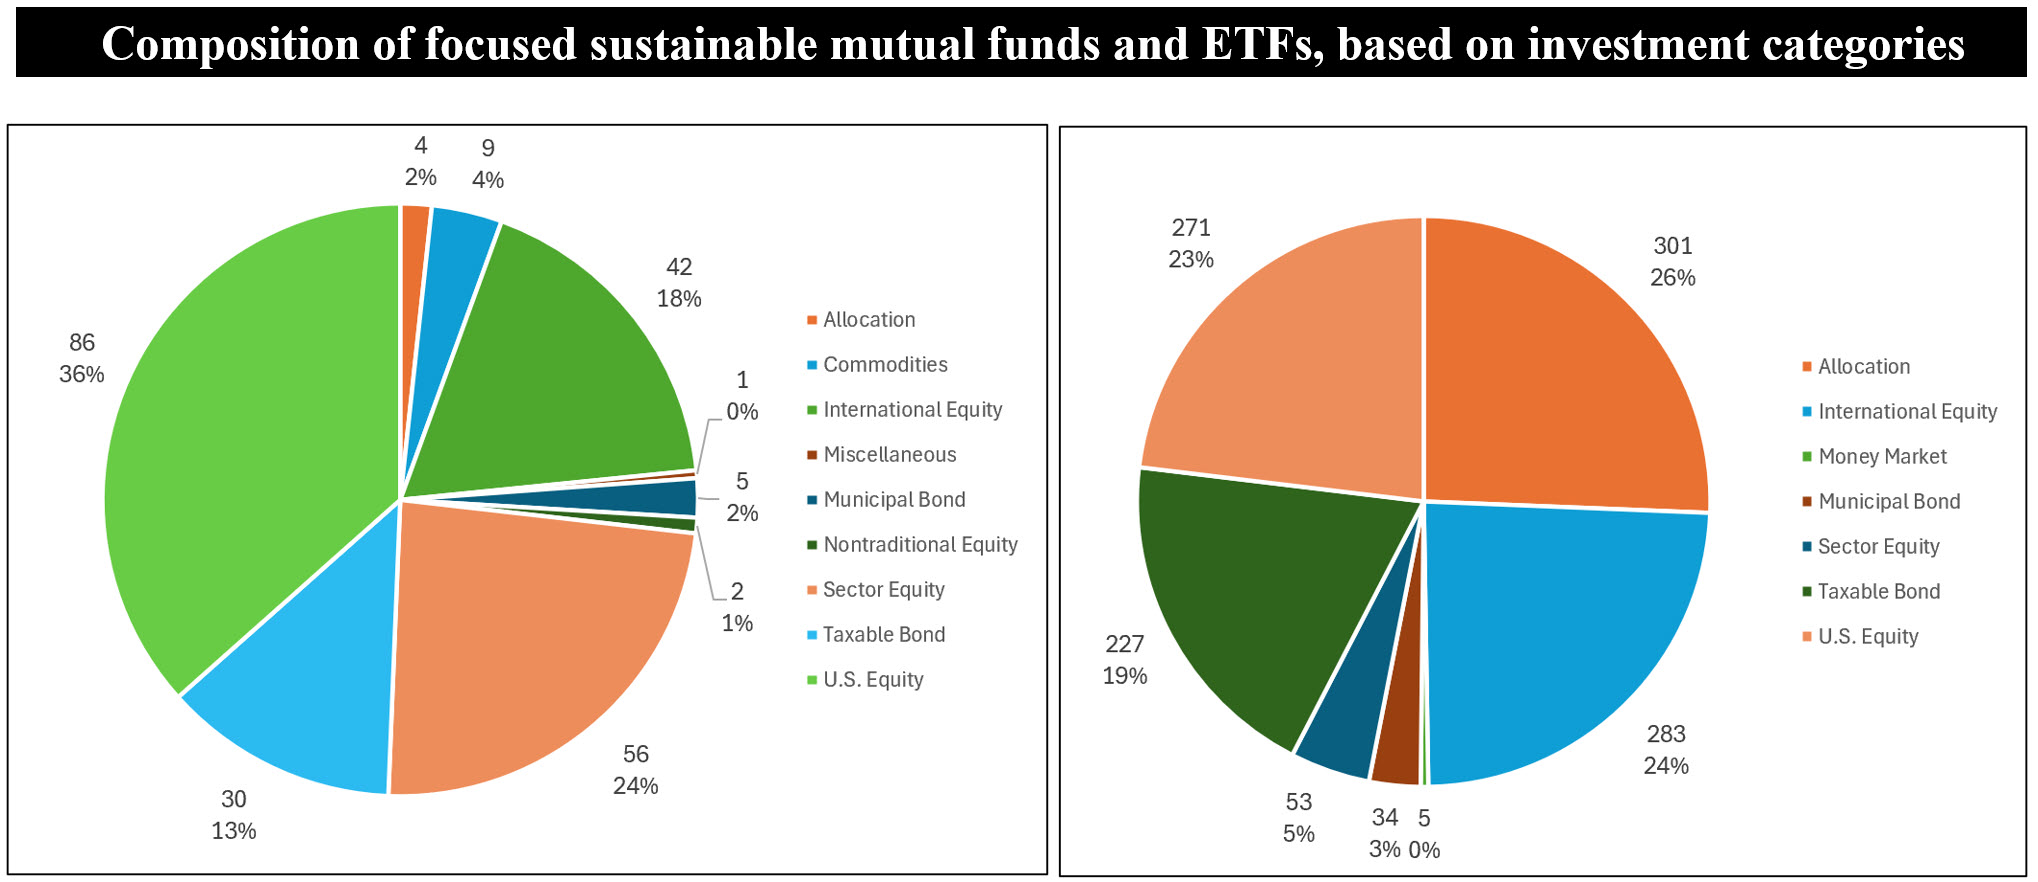
Notes of explanation: Charts reflect the number of funds that comprise each broad investment category and percentage of assets invested in the category, as of October 31, 2024. Sources: Morningstar Direct, Sustainable Research and Analysis LLC.
Observations:
• On a combined basis, focused sustainable mutual funds and ETFs, a total of 1,409 funds/share classes, ended October 2024 with $357.4 billion in assets under management. These funds consist of 235 ETFs with $110.2 billion in net assets and 1,174 funds/share classes with $247.2 billion in net assets.
• Focused sustainable mutual funds and ETFs registered an average decline of 2.63% in October. At the same time, sustainable mutual funds and ETFs posted average returns of -2.54% and -3.11%, respectively, or a difference of 53 basis points*. Average performance results also varied when measured over the year-to-date and trailing 12-month intervals, which for mutual funds were 9.43% and 23.68% and for ETFs were 6.61% and 22.28%, respectively.
• Variations in average performance results between the two groupings of funds can be attributed to various factors, key of which include differences in (1) the composition of the broad fund categories, sub-categories and in some cases, fund mandates that make up each of the sub-categories, (2) the number of funds in each category, (3) the size of funds in each category, (4) the number of index funds versus actively managed funds, and (5) fund expense ratios.
• The Sector Equity category, for one, illustrates the nature of variations in average performance due to differences in the composition of the category and its component sub-categories. At the end of October, there were 56 Sector Equity ETFs with some $12.1 billion in assets, comprised of 11 sub-categories, including a Miscellaneous sub-category with 16 ETFs. The mandate of these ETFs is largely to focus on clean energy and renewable energy, a sector that has been facing a challenging environment due to political and policy uncertainties, elevated interest rates, supply chain disruptions and competitive pressures that have contributed to their underperformance relative to other sectors. In October, these funds recorded an average decline of 7.73%, while returns ranged from a high of -4.07% to a low of -15.9%. In contrast, while the Sector Equity mutual funds category is comprised of a similar number of funds, total assets stand at only $4.7 billion, or almost two-thirds lower, it is made up of only eight sub-categories, including a Miscellaneous sub-category that is comprised of seven funds. These seven funds were down 6.73% in October, a full percentage point higher, and returns ranged from a positive 6.89% to a low of -9.07%. These factors contributed to the overall 53 bps differential in the performance of sustainable mutual funds versus ETFs.
• The above-mentioned variations between the two groupings introduce challenges when trying to compare the performance results achieved by mutual funds and ETFs over time. Similar challenges apply when attempting to evaluate and compare the performance results achieved by focused sustainable funds versus conventional funds. To produce acceptable outcomes, studies that attempt to do so must be undertaken with attention to these as well as additional relevant factors.
*Calculating the groupings’ average weighted results for the month of October reduces the overall variation by 4 bps.


