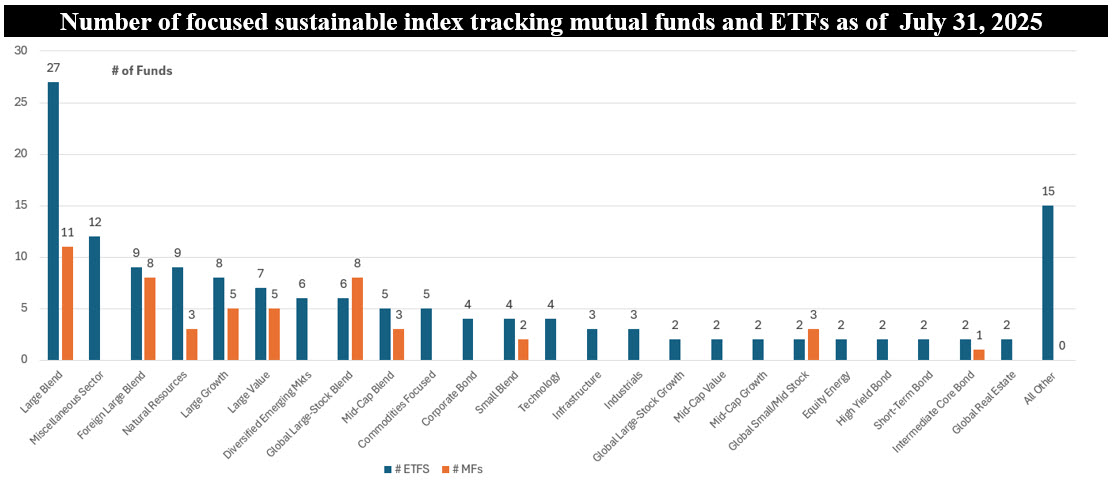
Notes of Explanation: Listings are in descending order based on the number of index tracking ETFs. All Other includes investment categories with only one ETF index fund offering and there are no corresponding single index tracking mutual funds: Intermediate Core-Plus Bond, Small Growth, Global Aggressive Allocation, Global Bond-USD Hedged, Trading–Leveraged Equity, Ultrashort Bond, Real Estate, China Region. Global Moderate Allocation, Consumer Cyclical, Global Moderately Conservative Allocation, Health, Global Bond, Muni National Intermediate, and Global Conservative Allocation. Sources: Fund documents, Morningstar and Sustainable Research and Analysis LLC.
Observations:
• The just released S&P Dow Jones Indices SPIVA U.S. Scorecard(1) for the first half of 2025 reports that 54% of actively managed large-cap U.S. equity funds underperformed the S&P 500 Index, a widely followed benchmark that includes 500 leading US companies and covers approximately 80% of available market capitalization. This represents an improvement from the 65% rate observed over the full-year 2024 and an average rate of 64% since 2001. According to S&P Dow Jones “the dueling winds from the outperformance of the U.S. equity market’s largest stocks, coupled with macro uncertainty and higher dispersion, amalgamated in greater potential opportunities for stock pickers to shine than in previous years.”
• It was also a better 6-month interval for actively managed mid-cap and small-cap funds, segments in which only 25% of mid-cap funds and only 22% of small-cap funds underperformed. These compare to 62% and 30% rates realized over the full-year 2024, respectively.
• On the other hand, fixed income results were generally worse. Underperformance over the first six months of the year reached 68% across all fixed income fund categories, in part due to lower returns realized from riskier credit exposures.
• That said, the results for the full year 2025 across all three market-cap segments and asset classes could still change. Also, while equivalent metrics are not provided for focused actively managed sustainable mutual funds and ETFs, there is little reason to believe that the results would be materially different.
• While the relative short-term results delivered by actively managed equity funds is encouraging, SPIVA’s latest report does not negate the conclusions that a majority of actively managed funds underperform their benchmarks over longer periods and that underperformance tends to increase with longer time horizons, meaning fewer active funds sustain long-term success. Still, in some market segments with low liquidity, limited information or under-researched companies, active managers may be able to add value. Otherwise, lower-cost index funds tend to outperform higher-cost actively managed funds due to expense ratios and trading costs. These findings also hold relevance for investors pursuing sustainable strategies, where active funds face similar challenges of underperformance.
• Investors who wish to pursue a passively managed sustainable investing strategy either on a selective basis or to the extent possible across their portfolio can take advantage of passively managed options within the focused sustainable mutual funds and ETFs space. In total, 194 passively managed sustainable index funds/share classes are available to sustainable investors out of a total of 1,250 focused sustainable funds/share classes offered as of July 31, 2025. These include 145 ETFs with $109.3 billion in assets under management and a smaller segment of 20 mutual funds/49 share classes with $45.5 billion in assets under management across stocks, bonds as well as commodities and some 39 investment categories. That said, some of the categories that should be considered when constructing diversified sustainable portfolios are constrained due to a limited number of offerings or none at all, including, for example, high yield funds, real estate funds and inflation protected bond funds. In such instances, investors may need to blend sustainable with conventional funds.
(1) The SPIVA (S&P Indices vs. Active) scorecard measures the performance of actively managed funds against relevant market benchmarks over various time periods. It provides data on how many active funds failed to outperform their benchmarks, with corrected data to account for survivorship bias and to ensure "apples-to-apples" comparisons.