The Bottom Line: Fast tracking the energy transition at COP 28 could stimulate the performance of clean and renewable energy funds, overcoming recent poor performance.
COP 28 expected to focus on setting more ambitious emissions reduction targets for this decade and beyond
The 28th Conference of the Parties to the United Nations Framework Convention on Climate Change, or COP 28, is now in progress, having begun on November 30, 2023 in Dubai, United Arab Emirates (UAE). Already, a deal has been brokered to form a climate-related fund administered by the UN to pay for loss and damages sustained by developing countries. Delegates from almost 200 countries have come together once again to coordinate global climate action for the next year and beyond, this time focusing on four areas: Fast-tracking the energy transition and reducing emissions before 2030, putting nature, people, lives and livelihoods at the heart of climate action, including helping the most vulnerable communities adapt to the changes that are already occurring, delivering on climate finance by delivering on previously made commitments and setting the framework for a new deal on finance, and mobilizing inclusivity. Against a backdrop of record-breaking wildfires, catastrophic floods, unbearable heat waves, and an updated UN Emissions Gap Report 2023 showing that we are getting closer to breaching the temperature limits specified in the 2015 Paris Climate Agreement, COP 28 is expected to focus, in large part, on setting more ambitious emissions reduction targets for this decade and beyond 2030 to maintain the possibility of achieving the long-run temperature goal of the Paris Agreement. COP 28 results are likely to further boost the scale of renewable energy development and advance opportunities for investors to participate in the long-term growth of the renewable energy sector. Concentrated, thematic or targeted clean and renewable energy funds offer investors one pathway to participate in this long-term growth opportunity, even as such thematic stock-oriented funds are riskier and have suffered performance reversals in recent years. Sustainable as well as conventional investors who are willing to look beyond more recent results registered by clean energy stocks and thematic clean and renewable energy funds can do so by choosing to invest in one or more active or passively managed mutual funds or ETFs focused on energy transition. A selection of such active and passively managed equity funds is set forth in Tables 1 and 2./UN Gap Report shows some progress since Paris Climate Agreement but GHG emissions also set new records in 2022
The Emissions Gap Report 2023 from the UN Environmental Programme (UNEP) shows that in addition to an acceleration in the number, speed and scale of broken climate records, global GHG emissions and atmospheric concentrations of carbon dioxide (CO2) also set new records in 2022. Global GHG emissions¹ reached a new record of 57.4 gigatons of CO2 equivalent (GtCO2e). Refer to Chart 1. According to the just released report, it was found that there has been progress since the Paris Agreement was signed in 2015. Greenhouse gas emissions in 2030, based on policies in place, were projected to increase by 16% at the time of the agreement’s adoption. Today, the projected increase is 3%. However, predicted 2030 greenhouse gas emissions still must fall by 28% per cent for the Paris Agreement 2°C pathway and 42% for the 1.5°C pathway.
As things stand, fully implementing unconditional Nationally Determined Contributions (NDCs) made under the Paris Agreement would put the world on track for limiting temperature rise to 2.9°C above pre-industrial levels this century. Fully implementing conditional NDCs would lower this to 2.5°C.
The report calls for all nations to accelerate economy-wide, low-carbon development transformations. Countries with greater capacity and responsibility for emissions will need to take more ambitious action and support developing nations as they pursue low-emissions development growth.
The report looks at how stronger implementation can increase the chances of the next round of NDCs, due in 2025, bringing down greenhouse gas emissions in 2035 to levels consistent with 2°C and 1.5°C pathways. It also looks at the potential and risks of Carbon Dioxide Removal methods – such as nature-based solutions and direct air carbon capture and storage.
As global temperatures and greenhouse gas emissions break records, the latest Emissions Gap Report finds that current pledges under the Paris Agreement put the world on track for a 2.5-2.9°C temperature rise above pre-industrial levels this century, pointing to the urgent need for increased climate action. That said, it should be noted that based on other climate models, results differ.
Still, COP 28 results are likely to further boost the scale of renewable energy development and provide opportunities for investors to participate in the long-term growth of the renewable energy sector.
Chart 1: Total net anthropogenic GHG Emissions, 1990-2022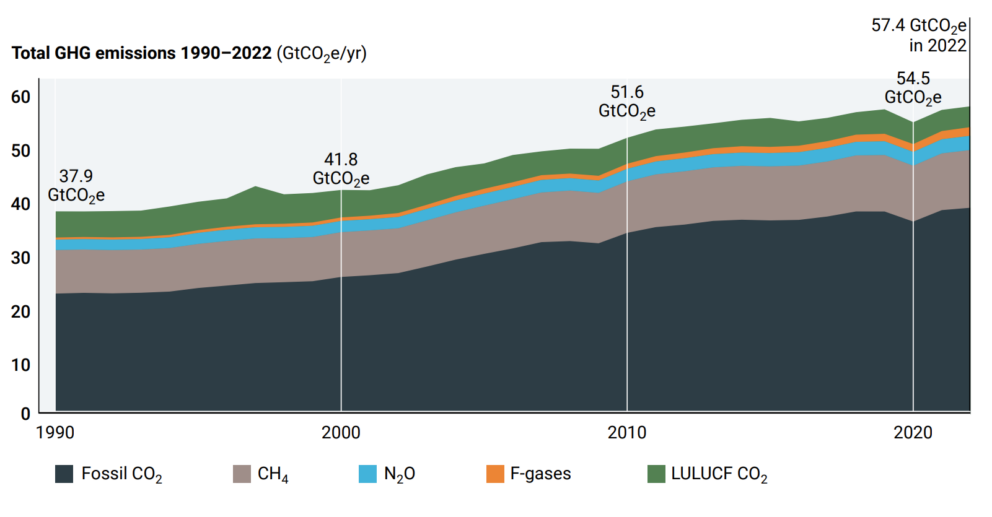 Notes of Explanation: GHG emissions include CO2 emissions, methane (CH4) emissions, nitrous oxide (N2O) and fluorinated gases (F-gasses). Source: UN Environment Programme (UNEP), Emissions Gap Report 2023
Thematic more narrowly focused clean and renewable energy funds offer to intermediate and long-term investors one pathway to participate in the potential growth of the sector
Sustainable as well as conventional investors who are willing to shrug off the very poor performance results recorded by narrower thematic mutual funds and ETFs investing in global clean and renewable energy stocks and to focus on the opportunities to participate in the intermediate to long-term growth potential in the sector due to the growing acceptance of climate change, demand for clean energy, declining costs and supportive government policies, can do so by choosing to invest in an expanding number of active or passively managed mutual funds or ETFs. Tables 1 and 2 feature a selection of 20 active and passively managed thematic, more narrowly focused specialized funds investing in companies involved in the clean energy sector, including companies that provide products and services that enable the evolution of a more sustainable energy sector that may benefit from the long-term secular growth of clean energy demand and the projected build-out of renewable energy generation across various sectors such as utility, industrial, technology, and energy. An example of a fund in this category is the index tracking $311.4 million ALPS Clean Energy ETF (ACES) that was launched in 2018. The fund is designed to provide exposure to a diverse set of US and Canadian companies involved in the clean energy sector including renewables and clean technology. The fund’s most recent top exposures include companies such as Rivian Automotive Inc. A, Tesla Inc., Enphase Energy Inc., Lucid Group, Inc. and First Solar, to mention just a few.
This fund, which suffered a 42.3% decline in the previous twelve months, along with other thematic funds pursuing a clean and renewable energy mandate, have suffered due to higher interest rates, inflation, supply-chain issues, inadequate electric transmission infrastructure and competition from China. According to the S&P Global Clean Energy Index, global clean and renewable energy stocks that were down 30.3% during the 12-months through the end of October and posted an average annual return of -11.44% over the previous 3-years. Against this backdrop, the selection of the 20 thematic renewable and clean energy actively managed funds as well as index funds in operation for at least 12-months posted an average decline of 20.5% over the trailing one-year interval and a negative 8.9% over the trailing three-years through the end of October. The range of returns varied, extending from a low of -42.3% over the trailing 12-month interval to a high of -1.9%. With fewer funds in existence over the last 3-years, the lowest average annual return registered by funds in existence for 3-years was -21.3% while the best return posted an average annual decline of 0.71%.
Excluded from this universe are funds that may combine climate considerations along with other ESG factors, including green and social bond funds. Also excluded from these lists are funds that provide broad exposure to companies that are better positioned to benefit from the transition to a low carbon economy and may also integrate ESG considerations into the investment decision making. An example of a fund in this category includes the actively managed BlackRock U.S. Carbon Transition Readiness ETF (LCTU). The fund, which was launched in 2021, is offered at a very attractive 0.14% and now manages almost $1.4 billion in net assets, has invested in companies such as Apple Inc., Microsoft Corp. Amazon.Com Inc. and Nvidia Corp, to mention just a few.
Benefiting recently from its exposure to the “Magnificent Seven,” the largest technology companies that have been driving the performance of the S&P 500, the performance of the BlackRock US Carbon Transition Readiness ETF along with other funds pursuing similar strategies stand in stark contrast to the performance results posted by ACES over the past year and during 2022 and 2021. LCTU is up 8.25% over the previous 12 months.
Thematic funds generally and the identified funds in particular tend to be riskier, especially when they are concentrated or exposed to leverage. They will exhibit higher levels of volatility over time—reaching higher highs and lower lows over a market cycle. In addition to risk considerations, investors should evaluate a fund’s mandate, record of stewardship investment track record, fund size and expense ratio, to mention the key variables.
While caution is advised, beaten down prices of clean energy stocks and related securities may be approaching a buying opportunity for intermediate and long-term investors. It’s tough to know when they might reach a trough. That said, the energy transition will continue to move forward and collective efforts to curb climate change to head off frequent and severe weather events by increasing our reliance on renewable energy and making advances in new technologies to reduce greenhouse gas emissions are not likely to diminish. To the contrary, they are more likely to get a lift from this year’s COP 28 climate conference.
Table 1a: Selection of actively managed thematic clean and renewable energy mutual funds
Fund Name | 1-Year TR (%) | 3-Year TR (%) | Net Assets ($) | Expense Ratio (%) |
Ecofin Global Energy Transition A | -20.47 | 24,774 | 1.15 | |
Ecofin Global Energy Transition Instl | -20.28 | 34,572,757 | 0.9 | |
Firsthand Alternative Energy | -19.38 | -8.99 | 10,009,945 | 2 |
GMO Climate Change I | -22.38 | -1.31 | 267,705,490 | 0.87 |
GMO Climate Change III | -22.28 | -1.18 | 278,627,786 | 0.77 |
GMO Climate Change R6 | -22.30 | -1.19 | 150,084,747 | 0.77 |
Goldman Sachs Clean Energy Income A | -23.77 | -9.19 | 2,720,149 | 1.26 |
Goldman Sachs Clean Energy Income C | -24.37 | -9.89 | 367,505 | 2.01 |
Goldman Sachs Clean Energy Income Ins | -23.49 | -8.87 | 5,650,985 | 0.89 |
Goldman Sachs Clean Energy Income Inv | -23.58 | -8.97 | 1,958,056 | 1.01 |
Goldman Sachs Clean Energy Income P | -23.48 | -8.83 | 107,210,235 | 0.88 |
Goldman Sachs Clean Energy Income R6 | -23.48 | -8.86 | 73,844 | 0.88 |
Guinness Atkinson Alternative Energy | -16.94 | -0.71 | 24,214,448 | 1.1 |
Kayne Anderson Renewable Infras I | -22.28 | -6.72 | 47,860,508 | 1.0 |
Kayne Anderson Renewable Infras Retail | -22.50 | 2,949,105 | 1.25 | |
Averages | -22.07 | -6.23 | 62,268,689 | 1.12 |
Notes of Explanation: Total return performance results to October 31, 2023. Blank performance indicates that the fund was not in existence over the entire trailing 3-year period. 3-Year TR=Average annual rate of return. Sources: Morningstar Direct, Sustainable Research and Analysis LLC.
Table 1b: Selection of passively managed thematic clean and renewable energy mutual funds
Fund Name | 1-Year TR (%) | 3-Year TR (%) | Net Assets ($) | Expense Ratio (%) |
Calvert Global Energy Solutions A | -6.10 | -1.02 | 78,152,741 | 1.24 |
Calvert Global Energy Solutions C | -6.83 | -1.75 | 7,321,501 | 1.99 |
Calvert Global Energy Solutions I | -5.86 | -0.76 | 61,665,219 | 0.99 |
Averages | -6.26 | -1.18 | 49,046,487 | 1.41 |
Notes of Explanation: Total return performance results to October 31, 2023. Blank performance indicates that the fund was not in existence over the entire trailing 3-year period. 3-Year TR=Average annual rate of return. Sources: Morningstar Direct, Sustainable Research and Analysis LLC.
Table 2a: Selection of actively managed thematic clean and renewable energy ETFs
Fund Name | 1-Year TR (%) | 3-Year TR (%) | Net Assets ($) | Expense Ratio (%) |
BlackRock Future Climate and Sus Eco ETF | -2.16 | 3,680,892 | 0.7 | |
JPMorgan Climate Change Solutions ETF | -1.91 | 18,813,371 | 0.49 | |
Neuberger Berman Carbon Transition & Infrs ETF | -4.40 | 23,043,208 | 0.55 | |
Virtus Duff & Phelps Clean Energy ETF | -26.87 | 6,285,220 | 0.59 | |
Averages | -8.84 | 12,995,673 | 0.58 |
Notes of Explanation: Total return performance results to October 31, 2023. Blank performance indicates that the fund was not in existence over the entire trailing 3-year period. 3-Year TR=Average annual rate of return. Sources: Morningstar Direct, Sustainable Research and Analysis LLC.
Table 2b: Selection of passively managed thematic clean and renewable energy ETFs
Fund Name | 1-Year TR (%) | 3-Year TR (%) | Net Assets ($)` | Expense Ratio (%) |
ALPS Clean Energy ETF | -42.31 | -21.26 | 311,426,198 | 0.55 |
Fidelity Clean Energy ETF | -31.96 | 25,240,383 | 0.39 | |
First Trust NASDAQ® Cln Edge® GrnEngyETF | -36.19 | -14.50 | 941,771,849 | 0.58 |
Global X Renewable Energy Producers ETF | -23.14 | -12.55 | 43,796,687 | 0.66 |
Goldman Sachs Bloomberg Cln Enrgy Eq ETF | -11.63 | 7,585,911 | 0.45 | |
Invesco Global Clean Energy ETF | -25.66 | -17.75 | 131,690,561 | 0.75 |
-39.06 | -29.77 | 411,652,210 | 0.66 | |
-29.97 | -12.76 | 2,624,795,696 | 0.41 | |
VanEck Low Carbon Energy ETF | -9.82 | -8.43 | 140,506,535 | 0.61 |
Averages | -27.75 | -16.72 | 575,385,119 | 0.56 |
Notes of Explanation: Total return performance results to October 31, 2023. Blank performance indicates that the fund was not in existence over the entire trailing 3-year period. 3-Year TR=Average annual rate of return. Sources: Morningstar Direct, Sustainable Research and Analysis LLC.
¹ GHG emissions include CO2 emissions, methane (CH4) emissions, nitrous oxide (N2O) and fluorinated gases (F-gasses).