The Bottom Line: The S&P 500 Index, which gained 18.4% in 2020, added 3.84% in December while sustainable fund managers prevailed in equities and bonds.
The S&P 500 which gained 18.4% in 2020, added 3.84% in December while active sustainable fund managers prevailed
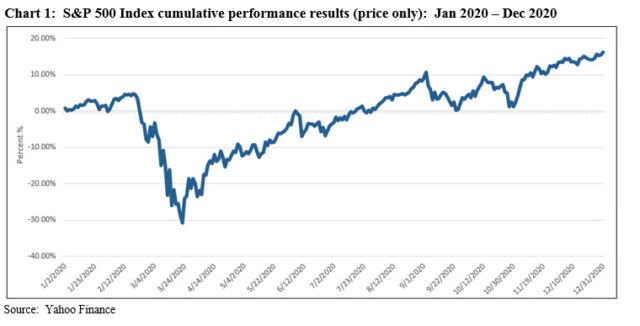
The S&P 500, which was down as much as 33.93% between February 19 and March 23 due to the coronavirus pandemic but then added 67.88% from the low, posted a 2020 calendar year total return of 18.4%. The Dow Jones Industrial Average and the Nasdaq Composite added 9.72% and 44.92%, respectively. Much of the increase beyond the year’s break-even point for the S&P 500 was largely realized during the last two months during which time the broad index gained 15.5% based on price performance. Refer to Chart 1. Concerns about COVID-19 and its widespread impacts were downgraded while more weight was assigned to the rapid fiscal and monetary stimulus of historic proportions and the consequent economic recovery in a low interest rate environment. During the last two months of the year, investors seemed to react to the Biden election results as well as optimism regarding the likely course of the pandemic once two COVID-19 vaccines were approved for use in the US. The impact that these developments will have on the economy and corporate earnings in 2021 pushed share prices to record levels and sky high valuations. When the year ended, the S&P 500 was trading at a forward P/E of 23 and a trailing 12-month P/E of 30. Questions surfaced regarding the market’s vulnerability.
The S&P 500 gained 3.84% in December, but it was eclipsed by the performance of mid-cap and small- cap stocks that registered one month gains of 6.37% and 8.16%, respectively. Except for mid-caps, growth outperformed value stocks while small cap stocks exceeded the performance of large caps. Large cap financial stocks led in December, gaining 6.05%, followed by the Information Technology and Energy sectors that picked up 5.68% and 4.27%, in that order. The full year results, however, were less cheerful with negative outcomes sourced to financial stocks, down -4.10%, and the Energy sector that declined -37.31%. Information Technology, on the other hand, added 42.21%. The Utilities sector’s lagging but positive 0.42% December results were negative for the year at -2.83%.
Overseas, the MSCI ACWI ex USA Index posted a gain of 5.41% in December and 10.65% for the year. Emerging markets delivered even better results, adding 7.35% during the last month of the year and 18.32% in 2020. The MSCI EAFE Index lagged these benchmarks, recording a monthly gain of 4.65% in December and 7.82% for the year. Some regions and individual countries posted some of the best monthly gains, with Latin America registered an increase of 12.88% based on the S&P Latin America 40 Total Return Index while the FTSE Greece Index came in at 12.63%.
Against a backdrop of low interest rates that reached 0.52% on August 4th but which started the year at 1.92% for 10-year Treasuries and ended at 0.93%, the Bloomberg Barclays US Aggregate Bond Index gained 0.14% in December and 7.51% in 2020. At the same time, the Bloomberg Barclays Global Aggregate Index added 1.34% and 9.2% in December and 2020, respectively. US corporate high yield bonds produced a gain of 1.88% in December and 7.11% in 2020.
ESG Indices: Active sustainable managers outperformed for second month in a row while sustainable indices lagged
Measured using three sustainable fund indices, actively managed sustainable equity funds, US oriented and foreign, as well as sustainable bond funds outperformed their conventional benchmarks in December. At the same time, December was not a good month for the performance of selected ESG securities market indices relative to their comparative conventional counterparts. That said, with one exception, sustainable securities market indices eclipsed the total return performance of their conventional counterparts over periods extending from one-to-five years ended December 31, 2020.
The Sustainable (SUSTAIN) Large Cap Equity Fund Index, the SUSTAIN Bond Fund Index and the SUSTAIN Foreign Fund Index, each of which tracks the performance of the ten largest similarly managed mutual funds that pursue a sustainable investing approach, outperformed their comparative conventional indices by margins ranging from 3 basis points (bps) to 13 bps. On the other hand, leading sustainable indices lagged their conventional counterparts by margins ranging from 1 bps to 242 bps.
strong>Sustainable securities market indices lag for the second month in a row
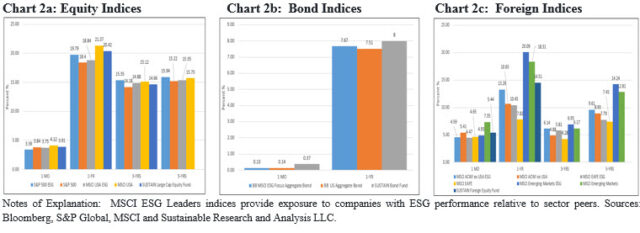
For the second month in a row selected sustainable securities market indices across market segments lagged behind their conventional counterparts in December. Both the S&P 500 ESG Index and the MSCI USA ESG Leaders indices trailed their conventional counterparts by 45 bps and 37 bps, respectively. They also both lagged in the fourth quarter, but while the S&P 500 ESG Index regains leadership relative to the S&P 500 for periods of one-year and beyond the MSCI USA ESG Leaders Index continues to tail for the 1-year, 3, 5 and 10-year intervals.
The Bloomberg Barclays ESG Focus Aggregate Bond Index lagged behind the conventional benchmark by a very narrow 1 basis point. This is not the case for the MSCI Emerging Markets ESG Index that trailed its conventional counterpart by a wide 2.42%. A number of factors will contribute to month-over-month variations. In December, the underperformance of the MSCI Emerging Markets ESG Index is likely sourced to an almost 2X weighting (10.74%) of Alibaba Group Holding ADR, a top 10 holding, that was down 11.63% in December while at the same time avoidance of Samsung Electronics, that made up 4.52% of the conventional benchmark, deprived the index from the 23.7% run up in the stock’s price during the same month. While sector weights were largely in line, country weightings appears to be a factor as well. The index benefited from its 6.53% overweight in Taiwan, up 10.54%, but this was not the case with the 2X underweight in South Korea which posted a strong 16.81% gain in December. Refer to Chart 2 a-c.
Sustainable (SUSTAIN) Large Cap Equity Fund Index betters the S&P 500 with a 3.91% gain
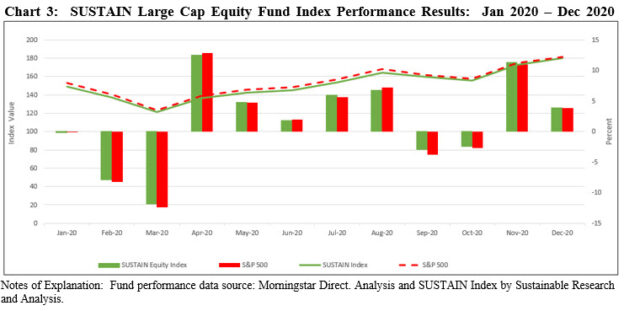
The Sustainable (SUSTAIN) Large Cap Equity Fund Index posted a gain of 3.91% versus the S&P 500, up 3.84%, for a positive differential of 7 bps. This was the fourth month in a row that the SUSTAIN Index outperformed, this month powered by six funds that registered individual total returns exceeding the conventional benchmark. Returns ranged from a low of 2.97% delivered by the ClearBridge Appreciation Fund A that recorded a gain of 2.97% to a high of 5.2% achieved by the GMO Quality Fund III. Refer to Chart 3.
The SUSTAIN Index also led the S&P 500 over Q4 and the entire 2020 calendar year.
Sustainable (SUSTAIN) Bond Fund Index exceeded the conventional benchmark by 13 bps
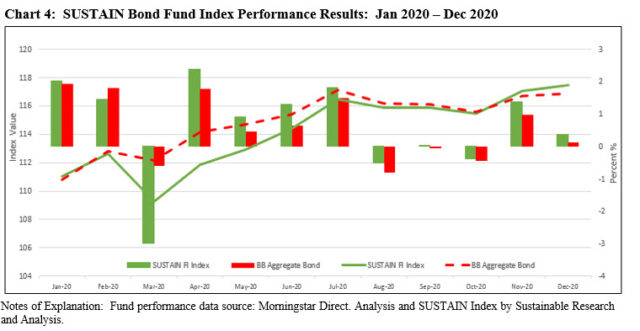
For the ninth month in a row, the SUSTAIN Bond Fund Index exceeded the performance of the Bloomberg Barclays US Aggregate Bond Index. The SUSTAIN Index posted a gain of 0.37% in December, and with its returns of 1.38% and 8.0% in the fourth quarter and the full year 2020, the index also beat the conventional benchmark by 71 bps and 49 bps, respectively. Refer to Chart 4.
All ten funds that comprise the index outperformed in December, producing returns ranging from 0.17% posted by the Pax Core Bond Fund I Shares to a high of 0.67% recorded by the Calvert Bond Fund I.
Sustainable (SUSTAIN) Foreign Fund Index outperformed by a narrow 3 basis points
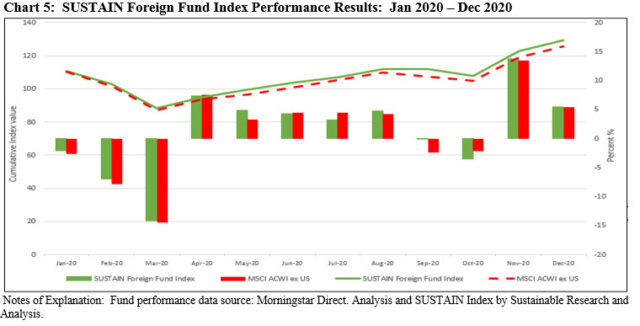
The SUSTAIN Foreign Fund Index added 5.43% in December versus 5.40% registered by the MSCI ACWI ex USA Index, or a narrow 3 basis points positive differential. The SUSTAIN Index also led the conventional benchmark in the fourth quarter and full calendar year period, having returned 15.66% and 14.51%, respectively. Refer to Chart 5.
Four fund index members outperformed the MSCI ACWI ex USA Index, led by the 7.54% returns achieved by the Aberdeen International Sustainable Leaders Fund A Shares. Bringing up the rear in December was the BMO Pyford International Stock Fund I that recorded a 4.12% return.
December 2020 market commentary: Active sustainable fund managers prevailed
The Bottom Line: The S&P 500 Index, which gained 18.4% in 2020, added 3.84% in December while sustainable fund managers prevailed in equities and bonds.
Share This Article:
The Bottom Line: The S&P 500 Index, which gained 18.4% in 2020, added 3.84% in December while sustainable fund managers prevailed in equities and bonds.
The S&P 500 which gained 18.4% in 2020, added 3.84% in December while active sustainable fund managers prevailed
The S&P 500, which was down as much as 33.93% between February 19 and March 23 due to the coronavirus pandemic but then added 67.88% from the low, posted a 2020 calendar year total return of 18.4%. The Dow Jones Industrial Average and the Nasdaq Composite added 9.72% and 44.92%, respectively. Much of the increase beyond the year’s break-even point for the S&P 500 was largely realized during the last two months during which time the broad index gained 15.5% based on price performance. Refer to Chart 1. Concerns about COVID-19 and its widespread impacts were downgraded while more weight was assigned to the rapid fiscal and monetary stimulus of historic proportions and the consequent economic recovery in a low interest rate environment. During the last two months of the year, investors seemed to react to the Biden election results as well as optimism regarding the likely course of the pandemic once two COVID-19 vaccines were approved for use in the US. The impact that these developments will have on the economy and corporate earnings in 2021 pushed share prices to record levels and sky high valuations. When the year ended, the S&P 500 was trading at a forward P/E of 23 and a trailing 12-month P/E of 30. Questions surfaced regarding the market’s vulnerability.
The S&P 500 gained 3.84% in December, but it was eclipsed by the performance of mid-cap and small- cap stocks that registered one month gains of 6.37% and 8.16%, respectively. Except for mid-caps, growth outperformed value stocks while small cap stocks exceeded the performance of large caps. Large cap financial stocks led in December, gaining 6.05%, followed by the Information Technology and Energy sectors that picked up 5.68% and 4.27%, in that order. The full year results, however, were less cheerful with negative outcomes sourced to financial stocks, down -4.10%, and the Energy sector that declined -37.31%. Information Technology, on the other hand, added 42.21%. The Utilities sector’s lagging but positive 0.42% December results were negative for the year at -2.83%.
Overseas, the MSCI ACWI ex USA Index posted a gain of 5.41% in December and 10.65% for the year. Emerging markets delivered even better results, adding 7.35% during the last month of the year and 18.32% in 2020. The MSCI EAFE Index lagged these benchmarks, recording a monthly gain of 4.65% in December and 7.82% for the year. Some regions and individual countries posted some of the best monthly gains, with Latin America registered an increase of 12.88% based on the S&P Latin America 40 Total Return Index while the FTSE Greece Index came in at 12.63%.
Against a backdrop of low interest rates that reached 0.52% on August 4th but which started the year at 1.92% for 10-year Treasuries and ended at 0.93%, the Bloomberg Barclays US Aggregate Bond Index gained 0.14% in December and 7.51% in 2020. At the same time, the Bloomberg Barclays Global Aggregate Index added 1.34% and 9.2% in December and 2020, respectively. US corporate high yield bonds produced a gain of 1.88% in December and 7.11% in 2020.
ESG Indices: Active sustainable managers outperformed for second month in a row while sustainable indices lagged
Measured using three sustainable fund indices, actively managed sustainable equity funds, US oriented and foreign, as well as sustainable bond funds outperformed their conventional benchmarks in December. At the same time, December was not a good month for the performance of selected ESG securities market indices relative to their comparative conventional counterparts. That said, with one exception, sustainable securities market indices eclipsed the total return performance of their conventional counterparts over periods extending from one-to-five years ended December 31, 2020.
The Sustainable (SUSTAIN) Large Cap Equity Fund Index, the SUSTAIN Bond Fund Index and the SUSTAIN Foreign Fund Index, each of which tracks the performance of the ten largest similarly managed mutual funds that pursue a sustainable investing approach, outperformed their comparative conventional indices by margins ranging from 3 basis points (bps) to 13 bps. On the other hand, leading sustainable indices lagged their conventional counterparts by margins ranging from 1 bps to 242 bps.
strong>Sustainable securities market indices lag for the second month in a row
For the second month in a row selected sustainable securities market indices across market segments lagged behind their conventional counterparts in December. Both the S&P 500 ESG Index and the MSCI USA ESG Leaders indices trailed their conventional counterparts by 45 bps and 37 bps, respectively. They also both lagged in the fourth quarter, but while the S&P 500 ESG Index regains leadership relative to the S&P 500 for periods of one-year and beyond the MSCI USA ESG Leaders Index continues to tail for the 1-year, 3, 5 and 10-year intervals.
The Bloomberg Barclays ESG Focus Aggregate Bond Index lagged behind the conventional benchmark by a very narrow 1 basis point. This is not the case for the MSCI Emerging Markets ESG Index that trailed its conventional counterpart by a wide 2.42%. A number of factors will contribute to month-over-month variations. In December, the underperformance of the MSCI Emerging Markets ESG Index is likely sourced to an almost 2X weighting (10.74%) of Alibaba Group Holding ADR, a top 10 holding, that was down 11.63% in December while at the same time avoidance of Samsung Electronics, that made up 4.52% of the conventional benchmark, deprived the index from the 23.7% run up in the stock’s price during the same month. While sector weights were largely in line, country weightings appears to be a factor as well. The index benefited from its 6.53% overweight in Taiwan, up 10.54%, but this was not the case with the 2X underweight in South Korea which posted a strong 16.81% gain in December. Refer to Chart 2 a-c.
Sustainable (SUSTAIN) Large Cap Equity Fund Index betters the S&P 500 with a 3.91% gain
The Sustainable (SUSTAIN) Large Cap Equity Fund Index posted a gain of 3.91% versus the S&P 500, up 3.84%, for a positive differential of 7 bps. This was the fourth month in a row that the SUSTAIN Index outperformed, this month powered by six funds that registered individual total returns exceeding the conventional benchmark. Returns ranged from a low of 2.97% delivered by the ClearBridge Appreciation Fund A that recorded a gain of 2.97% to a high of 5.2% achieved by the GMO Quality Fund III. Refer to Chart 3.
The SUSTAIN Index also led the S&P 500 over Q4 and the entire 2020 calendar year.
Sustainable (SUSTAIN) Bond Fund Index exceeded the conventional benchmark by 13 bps
For the ninth month in a row, the SUSTAIN Bond Fund Index exceeded the performance of the Bloomberg Barclays US Aggregate Bond Index. The SUSTAIN Index posted a gain of 0.37% in December, and with its returns of 1.38% and 8.0% in the fourth quarter and the full year 2020, the index also beat the conventional benchmark by 71 bps and 49 bps, respectively. Refer to Chart 4.
All ten funds that comprise the index outperformed in December, producing returns ranging from 0.17% posted by the Pax Core Bond Fund I Shares to a high of 0.67% recorded by the Calvert Bond Fund I.
Sustainable (SUSTAIN) Foreign Fund Index outperformed by a narrow 3 basis points
The SUSTAIN Foreign Fund Index added 5.43% in December versus 5.40% registered by the MSCI ACWI ex USA Index, or a narrow 3 basis points positive differential. The SUSTAIN Index also led the conventional benchmark in the fourth quarter and full calendar year period, having returned 15.66% and 14.51%, respectively. Refer to Chart 5.
Four fund index members outperformed the MSCI ACWI ex USA Index, led by the 7.54% returns achieved by the Aberdeen International Sustainable Leaders Fund A Shares. Bringing up the rear in December was the BMO Pyford International Stock Fund I that recorded a 4.12% return.
Sustainableinvest.com
Benefits
Free access to regularly updated original research and analysis focused exclusively on sustainable finance and investing, providing investors with the guidance needed to make informed investment decisions that align with their personal values and financial goals while also contributing to the advancement of positive long-term environmental and social outcomes.
By offering financial support for our current work, either in the form of a one-time or regular contributions, you help to defray some of the costs associated with conducting our research and analysis as well as to maintain the www.sustainableinvest.com website.
Helping us to expand our research capabilities and offerings over time to cover additional relevant topics geared to sustainable investors.
Sign up to free newsletters.
By submitting this form, you are consenting to receive marketing emails from: . You can revoke your consent to receive emails at any time by using the SafeUnsubscribe® link, found at the bottom of every email. Emails are serviced by Constant Contact