The Bottom Line: With index tracking sustainable ETF expense ratios rising, investors should closely scrutinize fund expenses and seek alternative lower cost funds if possible.
Introduction and summary
Expense ratios applicable to passively managed sustainable ETFs launched this year have been on the rise. Based on data applicable to 33 new sustainable ETFs listed this year to August 11th, both index trackers and actively managed funds, average and median expense ratios have risen to 54 bps and 59 bps, respectively, versus average and median expense ratios of 44 bps and 40 bps levied by ETFs in existence prior to 2021. While the number of actively managed ETFs have also been on the rise, research shows that the expense ratio increases is sourced to index ETFs rather than actively managed ETFs which generally command higher fees. This is a development that warrants scrutiny on the part of investors who may be considering investing in newly launched ETFs. Reason: a fund’s expense ratio can have a significant impact on the fund’s total return performance and should be an important consideration when deciding whether or not to invest in a fund. This article explores this near-term trend and offers investors guidance for consideration, namely to closely scrutinize expense ratios, particular attention should be focused on the fund’s total net assets and trajectory of assets under management, and to seek out any existing sustainable funds that may be employing a similar investment strategy with an established track record that may be offered at or reduced fees.
Recent expense ratio trends: The average expense ratio of newly listed sustainable index tracking ETFs is 14 bps higher
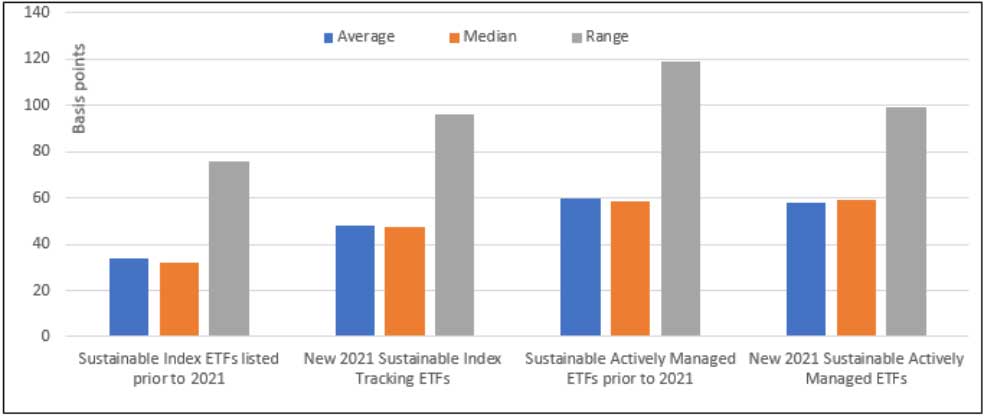
An analysis of sustainable ETFs launched prior to 2021¹ , a total of 125 funds, reveals that the average expense ratio attributable to this universe of funds stood at 44 bps while the median expense ratio was slightly lower at 40 bps. ETFs in the first quartile charged an expense of 20 bps while second quartile rose to 40 bps, or twice as high. The minimum expense ratio stood at 0% while the highest was 1.43% or 143 bps, for a range of 1.43% (if the 0% expense ratio is eliminated, the next highest expense ratio is 0.08% or 8 bps). Within this universe of funds, actively managed ETFs, a total of 26 funds, on average, charge almost twice as much as the 99 passively managed index tracking funds, that is 60 bps versus 34 bps. Actively managed fund expense ratios range from a low of 24 bps to a high of 143 bps versus index funds whose expense ratios range from a low of 0 bps to a high of 84 bps.
While the average expense ratio assessed by actively managed ETFs launched in 2021 remains largely unchanged at 58 bps, this is not the case for newly launched index funds. The average expense ratio for the 19 index tracking ETFs launched between the start of the year and August 11th is 48 bps, or 14 bps higher relative to seasoned index tracking ETFs. The minimum expense ratio is 11 bps and the maximum expense ratio is 107 bps. Even if the highest charging fund, the Direxion Dollar Global Clean Energy Bull 2X Shares that came to market in August and offers a leveraged bet on the performance of the Wilder Hill New Energy Global Innovation Index, is omitted, the average expense ratio is still 10 bps higher than the average for seasoned ETFs.
What is an expense ratio and why is it important?
The expense ratio is the annual fee that mutual funds, ETFs, closed-end funds and similar investment vehicles charge their shareholders or unitholders. It expresses the percentage of assets deducted each fiscal year for fund expenses, including 12b-1 fees, management fees, administrative fees, operating costs, and all other asset-based costs incurred by the fund. Fund expenses are typically deducted from a fund’s income before distribution to shareholders.
Across the universe of 158 ETFs in operation as of August 11, 2021, expense ratios range from a low of 0 bps charged by the Gabelli Love Our Planet & People ETF (LOPP) to a high of 1.43% or 143 bps charged by the Trend Aggregation ESG ETF (TEGS). This means that for every $100,000 invested in each of the two funds, a total of $0.00 is deducted every year from LOPP while $1,430 is deducted from TEGS. Assuming each fund returns 5% a year for ten years, investors in the Gabelli Love Our Planet & People ETF will realize $50,000 while investors in Trend Aggregation ESG ETF will realize $35,700, for a significant $14,300 differential² over a ten-year interval.
Investor guideposts: Fund expenses invite careful scrutiny and, if possible, seasoned alternative lower cost sustainable fund options should be sought out
With newly listed index tracking sustainable ETF expense ratios rising, what is an investor to do? First, investors should be aware that newly launched sustainable index tracking ETFs may be charging higher fees and therefore, expense ratios should be closely scrutinized. Second, in addition to the usual due diligence conducted by investors when any investment fund is being considered, particular attention should be directed on the fund’s total net assets and the trajectory of assets under management. This is relevant for all funds but especially so for newly launched ETFs that need to quickly ramp up assets under management to cover their operating expenses. Unless the fund reaches a level of profitability or has the potential for doing so, the ETF company is not likely to subsidize the fund for an indefinite interval, and without doing so, the ETF faces the prospect of liquidation or closure. Funds with higher expense ratios have to attract even more assets to achieve their financial break-even point or minimum level of profitability. While the break-even point will vary, for funds charging an average expense ratio of 48 bps (the average for newly listed sustainable index funds), break-even is roughly around $45 to $50 million in net assets under management³ . To avoid the near-term or intermediate-term prospects of a fund liquidation, investors should consider holding back and postpone investing in the fund until it reaches and/or exceeds break-even. Finally, investors should seek out any existing funds that may be employing a similar investment strategy that are offered at or reduced fees. Another benefit is that an existing fund, unlike a newly launched fund, is more likely to have an established performance and operations track record for vetting purposes.
| Sustainable ETFs listed prior to 2021 | All New Sustainable ETFs listed in 2021 | New 2021 Listed Sustainable Index Tracking ETFs | New 2021 Listed Sustainable Actively Managed ETFs | |
| Number of ETFs | 125 | 33 | 19 | 14 |
| Average | 44 | 54 | 48 | 58 |
| Median | 40 | 59 | 47.5 | 59 |
| Range | 135 | 107 | 96 | 99 |
| 1st Quartile | 20 | 39 | 30 | 39 |
| 2nd Quartile | 40 | 59 | 47.5 | 59 |
| 3rd Quartile | 60 | 72.5 | 65 | 75 |
| Minimum | 0 | 0 | 11 | 0 |
| Maximum | 143 | 107 | 107 | 99 |
| Fund Name | Net Assets ($) | Expense Ratio (%) |
| Direxion Dl Glbl Clean Ey Bull 2X Shrs | 4,944,891 | 1.07 |
| LGBTQ100 ESG ETF | 4,011,854 | 0.75 |
| iClima Glbl Dcrbnztn Trnstn Ldrs ETF | 1,032,834 | 0.65 |
| iClima Dstrbtd Rnwbl Enrgy Trntn Lds ETF | 2,096,984 | 0.65 |
| Amplify Cleaner Living ETF | 1,222,169 | 0.59 |
| ALPS Clean Energy ETF | 961,709,377 | 0.55 |
| Global X Clean Water ETF | 3,992,604 | 0.5 |
| IQ Healthy Hearts ETF | 7,092,378 | 0.45 |
| Direxion Hydrogen ETF | 34,185,799 | 0.45 |
| Invesco MSCI Green Building ETF | 5,019,235 | 0.39 |
| Defiance Next Gen H2 ETF | 35,182,606 | 0.3 |
| Xtrackers S&P MidCap 400 ESG ETF | 10,771,030 | 0.15 |
| Xtrackers S&P SmallCap 600 ESG ETF | 10,461,806 | 0.15 |
| Humankind US Stock ETF | 85,653,468 | 0.11 |
| Total/Average | 1,167,377,035 | 0.48 |
¹ Based on Morningstar’s narrow definition applied to sustainable mutual funds and ETFs that incorporates a view about how central sustainability criteria is in a manager’s investment decision making. Pursuant to this definition, a number of ETFs that integrate ESG in investment decision making, per prospectus language, are excluded from consideration. Examples include ETFs managed by JPMorgan and Eaton Vance, to mention just a few. For further discussion regarding fund classifications, refer to article entitled Rapid Growth in ESG Funds Calls for Adoption of Standards. https://sustainableinvest.com/rapid-growth-in-esg-funds-calls-for-adoption-of-standards/² This does not include the effect of compounding which will produce an even greater differential over time.³ Using the average expense ratio of 48 bps for newly launched sustainable index funds, annual fund operating expenses that could run between $220,000 and $240,000 or so would be covered once net assets reach about $45 to $50 million. Break-even levels will vary based on expense ratio levels.