Introduction and Summary
A review and analysis of the holdings representing investments by the largest actively managed sustainable [1]intermediate investment-grade bond funds as of September 30, 2019, all members of the Sustainable (SUSTAIN) Bond Fund Index, reflects significant variation in the composition of their portfolios across funds and relative to their conventional benchmark, the Bloomberg Barclays US Aggregate Index (BB). When viewed through the prism of their top 25 holdings, these funds display greater portfolio concentrations, yet a broader distribution of holdings across sectors, as well as limited investments in corporate securities versus Treasuries and agency securities. An exception to this includes two funds that avoid holdings in US Treasuries on the basis of their values-based approach to sustainable investing. Also, corporate securities, which are limited to an average of 3.1% of assets across the top holdings, are dominated by industries that tend to have more limited exposures to material sustainability issues that are likely to affect the financial condition or operating performance of such companies, namely financial institutions and consumer product companies[2]. Since the start of the year, the ten funds that comprise the SUSTAIN Bond Fund Index gained 9.23% versus an increase of 8.85% recorded by the Bloomberg Barclays US Aggregate Index, or a differential of 38 basis points. These findings are reviewed and summarized in this research article.
The Universe of funds: 10 funds with $10.3 billion in net assets
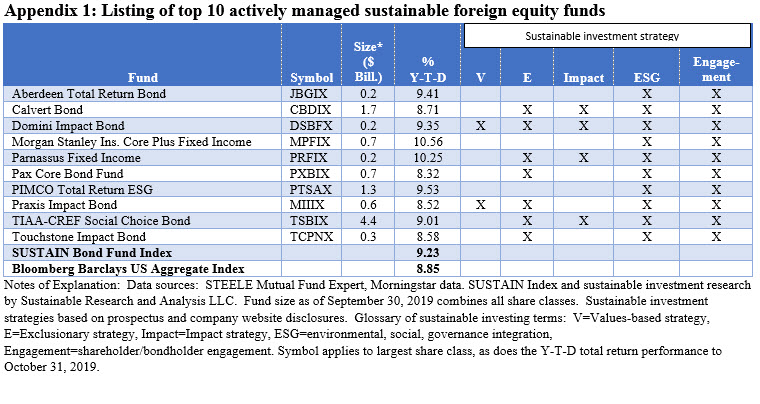
The universe of 10 funds comprise the Sustainable (SUSTAIN) Bond Fund Index, a benchmark that tracks the total return performance of the largest actively managed investment-grade intermediate term bond mutual funds that employ a sustainable investing strategy beyond absolute reliance on exclusionary practices for religious, ethical, social or other reasons. While methodologies vary, to qualify for inclusion in the benchmark, funds in excess of $50 million in net assets must actively apply environmental, social and governance (ESG) criteria to their investment processes and decision making. In tandem with their ESG integration strategy, funds may also employ exclusionary strategies, impact oriented investment approaches as well as issuer-oriented advocacy. The combined assets associated with the ten funds stood at $10.3 billion as of September 30, 2019. As of that date, the funds accounted for 4.9% of the sustainable taxable fixed income segment which expanded dramatically since the start of 2019 when the index was last reconstituted and the segment’s assets stood at $24.9 billion in total assets under management. Refer to Appendix 1 for a listing funds and their sustainable investing approaches.
Wide variations in exposures to US Treasury securities, securitized debt instruments and corporate bond holdings
A broad comparison of portfolio allocation strategies across the 10 funds versus their conventional benchmark, the Bloomberg Barclays Aggregate US Index, shows wide variations in exposures to US Treasury securities, securitized debt instruments and corporate bond holdings. Refer to Chart 1.
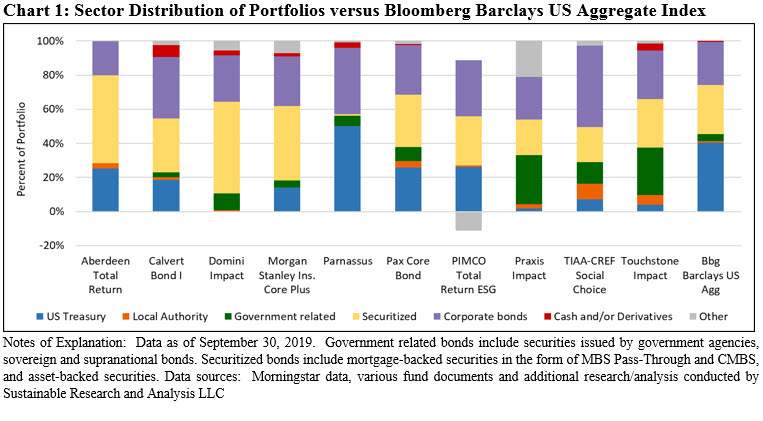
The greatest variance is observed within the US Treasury holdings and securitized debt segments that make up 18.02% and 32.02% of the Bloomberg Barclays US Aggregate Index, respectively, as the end of September, but range from an average 0.0% to 53.9% of fund holdings. Two funds, the Domini Impact Bond Fund and Praxis Impact Bond avoid investments in US Treasury securities altogether. In the case Praxis Impact Bond Fund, Treasury bills, notes and bonds are avoided in alignment with the Praxis stewardship investing principles. In the case of Domini, the fund avoids bonds and notes issued by the U.S. Treasury largely because of those securities’ role in funding weapons procurement and development for the military, although investments in government agency securities are eligible and securitized debt, including mortgage-backed pass through securities, accounted for 53.9% of portfolio assets. At the other end of the range, Parnassus Fixed Income Fund maintained a 50% exposure to US Treasury securities.
While not as wide, variations can also be observed in corporate bonds which average 32.3% relative to 25.4% for the benchmark but range from a low 19.9% exposure in the Aberdeen Total Return Bond Fund to a high of 47.89% invested in corporates by the TIAA-CREF Social Choice Bond Fund.
A more limited view of top 25 holdings across funds reveals a higher average level concentration of 33.4% versus 15.6% for the index
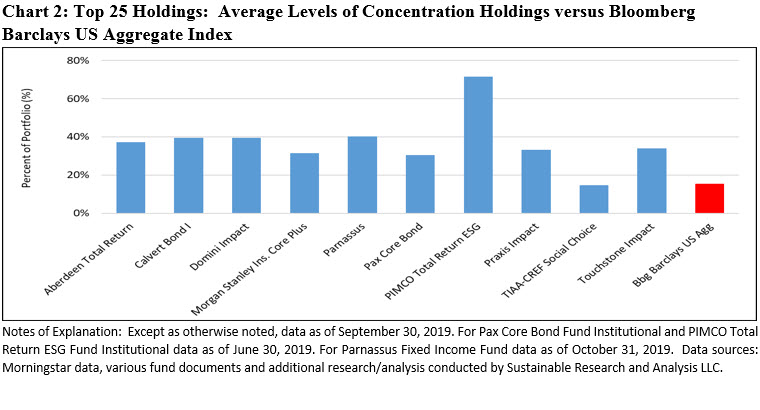
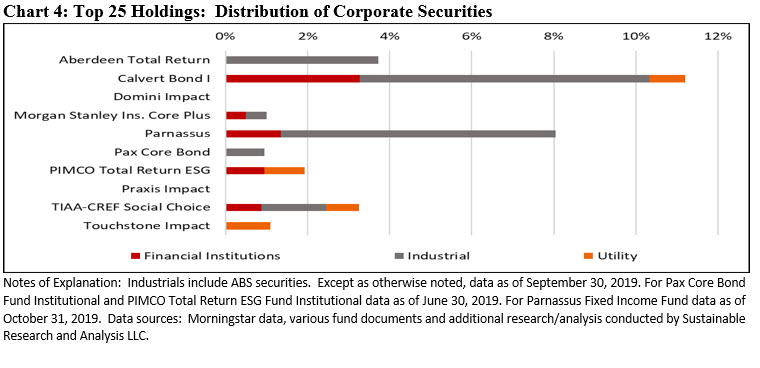
Limiting the review to the top 25 positions in each of the ten portfolios relative to the Bloomberg Barclays US Aggregate Index reveals that the funds, on average, maintain concentration levels that are twice as high as the benchmark while sector choices vary. The average level of fund concentration stands at 33.4% versus 15.6% for the index. Refer to Chart 2. It should be noted that this calculation excludes the PIMCO Total Return ESG Fund as the share of its top 25 holdings is an outlier at nearly 71.5% (the fund reported that about 20.4% of its net assets were in short sales, all MBS Pass-Through securities, and 9.7% in reverse repurchase agreements). The only fund with a concentration level in line with the benchmark is the TIAA-CREF Social Choice Bond Fund whose top 25 holdings account for 14.6% of the fund’s net assets. Even as that is the case, the fund’s allocations by sector varies given its underweighting in MBS securities and overweighting in corporate bonds at 3.26% versus 0.0% for the benchmark, consisting of financial institutions, industrials (including ABS) and utilities. Three other funds maintained an overweight position in industrials within the top portfolio holdings segment, including Calvert Bond at 7.06%, Aberdeen Total Return Bond at 3.72% and Parnassus Fixed Income at 6.70%.
Sector distribution of the funds’ top 25 holdings is broader compared to the index
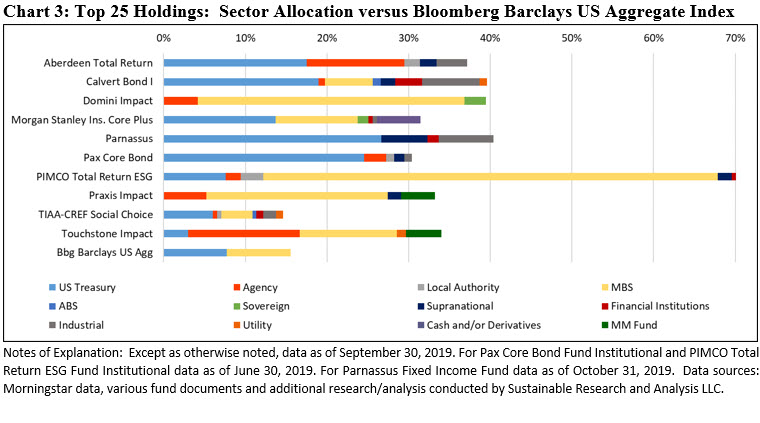
At the same time, the top 25 positions held by each of the ten portfolios relative to the Bloomberg Barclays US Aggregate Index are more broadly distributed across sectors and there is greater variation in holdings between funds. Excluding Domini Impact Bond Fund and Praxis Impact Bond Fund, the average exposure of the remaining eight funds to treasury bills, notes and bonds is 14.7%. This compares to 7.74% for the Treasury securities allocation across the top 25 securities holdings that comprise the Bloomberg Barclays index. Further, within their top 25 securities, allocations to US Treasuries varies significantly, from the Touchstone Impact Bond Fund’s 3.01% to 26.63% held by the Parnassus Fixed Income Fund. Another significant variation can also be observed in the holdings of MBS securities which account for an average of 14.2% across the ten funds but limited to 7.81% by the conventional index, for a 6.4% differential. Here too, investment variations across funds range from 0.0% by the Parnassus Fixed Income Fund to a gross allocation of 55.65% by the PIMCO Total Return ESG Fund. Refer to Chart 3. Treasuries and MBS securities comprise the sectors to which the 25 securities that make up the index are largely allocated. The funds, on the other hand, maintained holdings, on average, in every one of the index’s sectors, ranging, in descending order, from agency securities (4.08%), to utilities (2.05%) to financial institutions (1.40%) to mention just those with average investments over 1%. Refer to Chart 4.
Average corporate exposure across the top 25 holdings is limited to 3.1% of assets
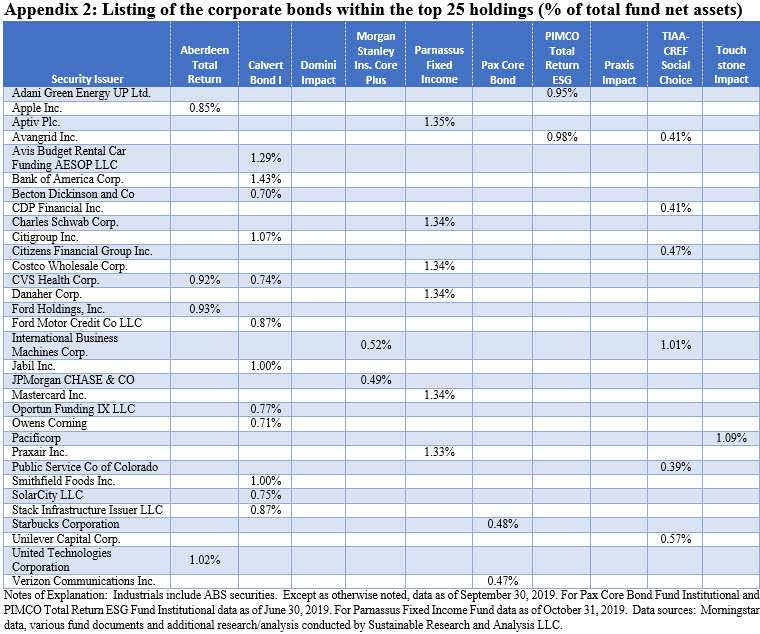
Corporate securities, within the top 25 holdings, including industrials (which also factors in ABS), financial institutions and utilities, average just 3.1% of portfolio assets and broadly consist of industrials, financial institutions and utilities. Average corporate investments range from a low of 0.0% reported by the Praxis Impact Bond Fund to a maximum of 11.2% held by Calvert Bond Fund. Also, the single most heavily weighted position across the ten funds makes up a maximum of 1.4% of fund net assets. Across their top holdings, the ten funds have investments in a combined total of 32 companies, including five asset backed securities. On the basis of their weightings within the portfolios, these companies are dominated by industries that tend to have more limited exposures to material sustainability issues that are likely to affect the financial condition or operating performance of such companies, namely financial institutions and consumer product companies. A list of the corporate bonds included in the top 25 holdings of the ten mutual funds can be found in Appendix 2.
Sustainable (SUSTAIN) Bond Fund Index gained 9.23% vs. 8.84% for the Bloomberg Barclays US Aggregate Index through October 31, 2019
While other relevant factors contribute to or may detract from portfolio performance, such as duration and credit quality, portfolio sector variations also effect total return results. Since the start of the year, the ten funds that comprise the SUSTAIN Bond Fund Index gained 9.23% versus an increase of 8.85% recorded by the Bloomberg Barclays US Aggregate Index, or a differential of 38 bps. Refer to Sustainable Indices Matched or Trailed Returns for the Month of October 2019.
[1] While the definition of sustainable investing continues to evolve, today it refers to a range of five overarching investing approaches or strategies that encompass: values-based investing, negative screening (exclusions), thematic and impact investing, ESG integration and shareholder/bondholder engagement and proxy voting. These are not mutually exclusive.
[2] Based on SASB Materiality
mapping.


