The Bottom Line: Reversing two consecutive months of declines, thematic green bond funds gained $29.4 million in November 2022 while total return performance lagged benchmarks.
November Summary
- Reversing two months of declines in net assets under management, the segment of thematic green bond funds, consisting of four mutual funds and three ETFs that offer investors exposure to environmental projects and investments while seeking market-based returns, experienced a net gain of $29.4 million in assets. The seven funds ended the month of November with $1.40 billion in assets under management, versus $1.37 billion the prior month. Outflows in the amount of $17.7 million were offset by market related gains of $47.1 million, for a net increase of $29.4 million. Refer to Chart 1.
- The top three gains in net assets were attributed to the Calvert Green Bond Fund A, I and R6 Share classes (CGAFX, CGBIX, and CBGRX), iShares USD Green Bond ETF (BGRN) and Franklin Municipal Green Bond ETF (FLMB). These funds added $12.3 million, $9.3 million, and $5.9 million in net assets, respectively.
- The bond market registered a strong month with yields in the US and Europe retreating significantly, leading to a 3.7% rally for the Bloomberg US Aggregate Bond Index and 4.7% for the Global Aggregate Bond index. Market related gains were realized as green bond funds posted an average 3.58% gain, including an increase of 6.19% recorded by the Franklin Municipal Green Bond ETF that invests in municipal securities whose interest is free from federal income taxes. Excluding BGRN, the average gain registered by green bond funds slid back to 3.44%.
- Funds investing in US dollar green bonds trailed conventional and green bond US dollar indices in November while taxable funds investing in US and non-US dollar green bonds failed to outperform the Bloomberg Global Aggregate Bond Index. At the same time, the Mirova Global Green Bond-Class A (MGGAX), N (MGGNX) and Y (MGGYX) beat the ICE BofAML Green Bond Index Hedged US Index. Refer to Table 1.
- Over the intermediate-term, periods covering the last twelve months and three-years, funds investing in US and non-US denominated green bonds exceeded the performance of the Bloomberg Global Aggregate Bond Index and ICE BofAML Green Bond Index Hedged US Index. Only the Mirova Global Green Bond Index-Class A (MGGAX), that reports a high 94 basis points expense ratio, failed to meet or exceed the two relevant benchmarks.
- Based on data through the end of October 31, 2022, it’s expected that issuance of sustainability-linked debt in calendar year 2022 will lag 2021. This includes green, social and sustainability bonds as well as loans. With another decline in the issuance volumes of sustainable bonds and loans registered in October, total year-to-date issuance, according to Bloomberg New Energy Finance, reached $1.2 trillion or about 16% behind 2021—a level that is projected to apply for the entire 2022 calendar year. Refer to Chart 2. By some estimates, green bonds reached almost $360 billion at the end of October and about $400 billion by the end of November. It should be noted that the decline in the issuance of sustainable bonds largely follows the downward trend of the global fixed income market, against a backdrop of market volatility and rising interest rates due to high and persistent inflation, recession fears and the Ukraine war, to mention just a few. While there are variations by issuers and bond types, estimates for global bond issuance in 2022 point to a 16% contraction and that is in line with estimates for sustainable bond volumes. That said, issuance is expected to recover in 2023 with sovereigns taking on an increasing role.
Chart 1: Green bond mutual funds and ETFs and assets under management – December 1, 2021 – November 30, 2022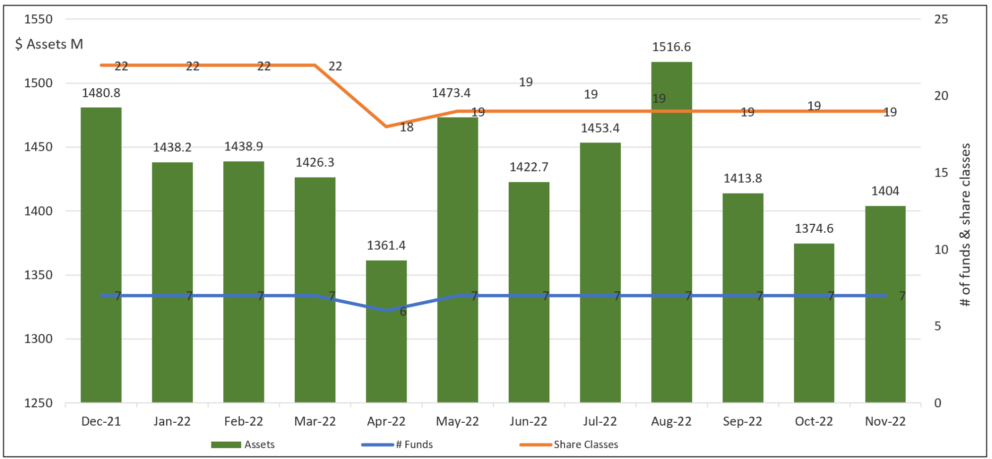 Notes of Explanation: Franklin Municipal Green Blond Fund and tis four share classes with total net assets of $9.7 million included in the data. At the same time, the rebranded Franklin Liberty Federal Tax-Free Bond ETF renamed the Franklin Municipal Green Bond ETF is excluded as of April 29, 2022. Fund total net assets data source: Morningstar Direct; fund filings. Research and analysis by Sustainable Research and analysis LLC
Chart 2: Cumulative sustainable debt issuance January 1, 2022 – October 31, 2022
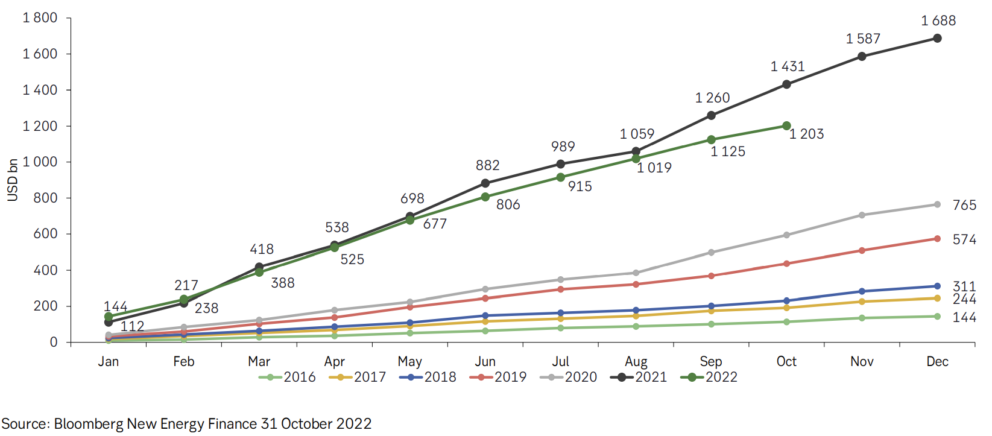
Table 1: Green bond funds: Performance results, expense ratios and AUM – Nov. 30, 2022
Name |
Symbol | 1-Month Return (%) | 3-Month Return (%) | Y-T-D Return (%) | 12-Month Return (%) | 3-Year Average Return (%) | 5-Year Average Return (%) | Expense Ratio (%)
| Net Assets ($M) |
Calvert Green Bond A* | CGAFX | 2.95 | -1.32 | -12.04 | -12.22 | -2.75 | 0.04 | 0.73 | 69.6 |
Calvert Green Bond I* | CGBIX | 2.97 | -1.19 | -11.82 | -11.99 | -2.5 | 0.32 | 0.48 | 635.1 |
Calvert Green Bond R6* | CBGRX | 2.97 | -1.17 | -11.77 | -11.93 | -2.45 | 0.43 | 38.6 | |
Franklin Municipal Green Bond ETF@ | FLMB | 6.19 | 0.11 | 0.3 | 106.5 | ||||
iShares USD Green Bond ETF^ | BGRN | 3.62 | -1.56 | -12.7 | -13.61 | -3.39 | 0.2 | 289.2 | |
Mirova Global Green Bond A* | MGGAX | 4.15 | -0.23 | -14.61 | -15.44 | -3.94 | -0.5 | 0.94 | 5.6 |
Mirova Global Green Bond N* | MGGNX | 4.25 | 0 | -14.31 | -15.15 | -3.65 | -0.19 | 0.64 | 5.3 |
Mirova Global Green Bond Y* | MGGYX | 4.14 | -0.12 | -14.43 | -15.28 | -3.7 | -0.25 | 0.69 | 28.1 |
PIMCO Climate Bond A* | PCEBX | 3.49 | -1.01 | -12.25 | -12.01 | 0.91 | 0.8 | ||
PIMCO Climate Bond C* | PCECX | 3.43 | -1.19 | -12.85 | -12.68 | 1.66 | 0 | ||
PIMCO Climate Bond I-2* | PCEPX | 3.52 | -0.93 | -12.01 | -11.75 | 0.61 | 0.4 | ||
PIMCO Climate Bond I-3* | PCEWX | 3.51 | -0.94 | -12.05 | -11.79 | 0.66 | 0.1 | ||
PIMCO Climate Bond Institutional* | PCEIX | 3.53 | -0.91 | -11.93 | -11.66 | 0.51 | 11.5 | ||
TIAA-CREF Green Bond Advisor* | TGRKX | 3.15 | -2.04 | -12.56 | -12.69 | -1.96 | 0.6 | 45.3 | |
TIAA-CREF Green Bond Institutional* | TGRNX | 3.16 | -2.12 | -12.52 | -12.65 | -1.94 | 0.45 | 72.5 | |
TIAA-CREF Green Bond Premier* | TGRLX | 3.15 | -2.16 | -12.64 | -12.78 | -2.07 | 0.6 | 0.9 | |
T TIAA-CREF Green Bond retail* | TGROX | 3.14 | -2.2 | -12.75 | -12.9 | -2.21 | 0.8 | 7 | |
TIAA-CREF Green Bond Retirement* | TGRMX | 3.15 | -2.17 | -12.65 | -12.79 | -2.07 | 0.7 | 13.7 | |
GRNB | 3.6 | -1.29 | -11.9 | -12 | -2.43 | -1.18 | 0.2 | 73.8 | |
Average/Total+ | 3.44 | -1.25 | -12.66 | -12.85 | -2.70 | -0.29 | 0.64 | 1404.0 | |
Bloomberg US Aggregate Bond Index | 3.68 | -2.09 | -12.62 | -12.84 | -2.59 | 0.21 | |||
Bloomberg Global Aggregate Bond Index | 4.71 | -1.36 | -16.7 | -16.82 | -4.47 | -1.69 | |||
Bloomberg Municipal Total Return Index | 4.68 | -0.18 | -8.79 | -8.64 | -0.77 | 1.4 | |||
S&P Green Bond US Dollar Select IX | 3.65 | -1.41 | -12.11 | -12.1 | -2.22 | -0.31 | |||
ICE BofAML Green Bond Index Hedged US Index | 3.64 | -0.95 | -14.63 | -15.36 | -3.94 | -0.02 |
Notes of Explanation: Blank cells=NA. 3 and 5-year returns are average annual total returns. +Average returns apply to taxable funds only and excludes Franklin Municipal Green Bond ETF. If Franklin is included, results are 3.58% in November and -1.18% over the trailing 3-months. *Fund invests in foreign currency bonds and performance should also be compared to a more narrowly based relevant index such as the ICE BofAML Green Blond Index Hedged US or equivalent. ** Fund invests in US dollar denominated green bonds only and performance should also be compared to a more narrowly based relevant index such as the S&P Green Bond US Dollar Select Index or equivalent. @Fund rebranded as of May 3, 2022. ^Effective March 1, 2022, fund shifted to US dollar green bonds. ^^As of September 3, 2019, the fund shifted to US dollar green bonds tracks the S&P Green Bond U.S. Dollar Select Index. Fund total net assets and performance data source: Morningstar Direct; fund filings. Research and analysis by Sustainable Research and Analysis LLC.