The Bottom Line: Gains in assets over the last four months shows investor confidence in green bonds even as performance has been in the red.
August Summary
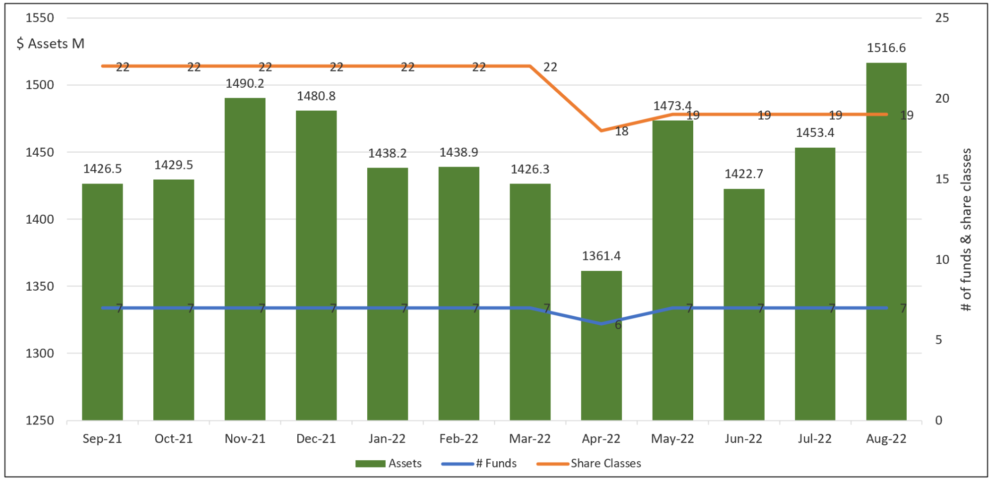
- Assets attributable to the segment of green bond funds, four mutual funds and three ETFs, gained $63.2 million in net assets during the month of August to reach a new high of $1,516.6 million. Refer to Chart 1. The segment experienced estimated cash inflows of $100.3 million, offset by about $37.1 million due to market depreciation. This is the best month-over-month gain so far this year, adjusting for the re-branding of the Franklin Municipal Green Bond ETF as of May 3rd and the shift of $101.9 million into the green bond funds segment. The biggest gain by a fund in August was realized by the TIAA-CREF Green Bond Fund that added $39 million in net assets, with $40.8 million attributable to the fund’s Advisor Shares class (TGRKX). The fund finally eclipsed the $100 million level the previous month and now stands at $139.4 million. The TIAA-CREF Green Bond Fund, which was launched in November 2018, is the best performing green bond fund over the trailing 3-year time period.
- Green bond funds posted an average return of -2.85% in August versus -2.83% recorded by the Bloomberg US Aggregate Bond Index and -3.46% and -4.47% registered by the Bloomberg Global Aggregate Bond Index and the ICE BofAML Green Bond Index Hedged US Index, respectively. The average performance of green bond funds, in part influenced by variations in returns due to a combination of exposures to US dollar and non-US dollar denominated green bonds as well as taxable and municipal bond funds, is lagging the broad-based Bloomberg US Aggregate Bond Index since the start of the year, the trailing 12-month and 3-year intervals. During the month of August returns ranged from a high of -1.94% attributable to both the Van Eck Green Bond ETF (GRNB) and TIAA-CREF Green Bond Fund Institutional Shares (TGRNX) to a low of -4.46% posted by the Mirova Global Green Bond Fund Y (MGGYX). Relative to the Mirova Global Green Bond Fund, both the leading funds in August had zero to a more modest exposure to non-US dollar denominated green bonds. Refer to Table 1.
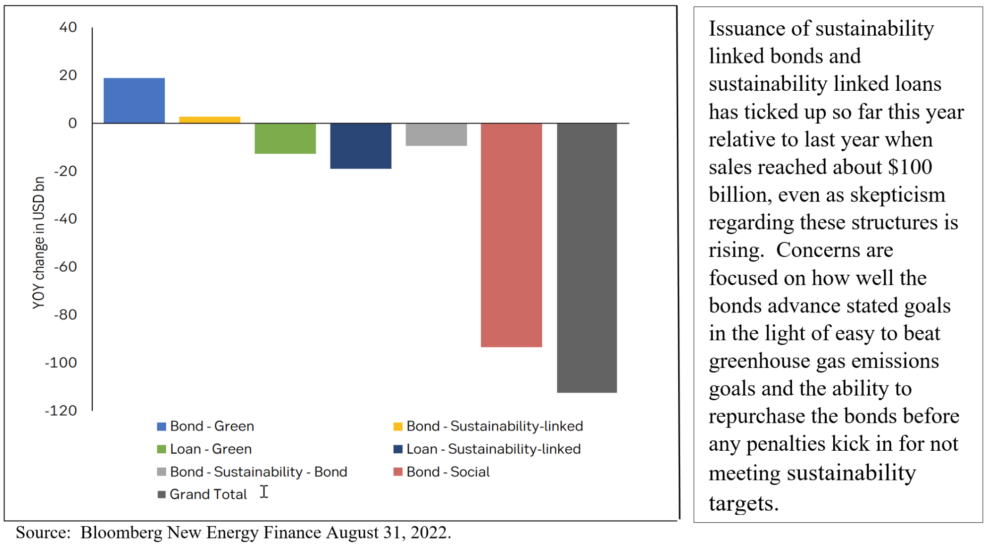
- According to recent data by Bloomberg New Energy Finance as reported by SEB, issuance of sustainability-themed bonds and loans continue to lag last year’s levels as total transactions at the end of August reached $946 billion or 11% behind comparable year-over-year levels. The decline in sustainable debt continued to impact the various types of categories, with social bonds and sustainability-linked loans reflecting the largest declines in terms of value. Refer to Chart 2. Issuance of sustainability linked bonds and sustainability linked loans has ticked up so far this year relative to last year when sales reached about $100 billion, even as skepticism regarding these structures is rising. Concerns are focused on how well the bonds advance stated goals in the light of easy to beat greenhouse gas emissions goals and the ability to repurchase the bonds before any penalties kick in for not meeting sustainability targets. That said, there are reasons to believe the overall sustainable bond market will recover. As noted in last month’s Green bond funds reverse course in July 2022 article (https://sustainableinvest.com/article-title-green-bond-funds-reverse-course-in-july-2022/), the passage of the Inflation Reduction Act (IRA), that included $369 billion in energy security and climate spending over the next 10 years, is likely to stimulate the issuance of sustainability-themed bonds. Also, Euro zone governments have raised 15 billion euros ($15 billion) from green bonds issued by Germany, Italy and the Netherlands over the last two weeks, pushing volumes above a year ago. At the same time, green bond sales in the Asia-Pacific region are likely to rise in 2022 as major economies lay out roadmaps to net-zero emissions and invest in projects to reduce carbon intensity. Demand for sustainable bonds remains strong and as bond markets stabilize, the caution exhibited by borrowers in recent months is likely to recede.
Chart 1: Green bond mutual funds and ETFs and assets under management – September 2021 – August 31, 2022 Notes of Explanation: Franklin Municipal Green Blond Fund and tis four share classes with total net assets of $9.7 million included in the data. At the same time, the rebranded Franklin Liberty Federal Tax-Free Bond ETF renamed the Franklin Municipal Green Bond ETF is excluded as of April 29, 2022. Fund total net assets data source: Morningstar Direct; fund filings. Research and analysis by Sustainable Research and analysis LLC
Chart 2: Year over year change in issuance-January – August 2022
Table 1: Green bond funds: Performance results, expense ratios and AUM-August 31, 2022
Name |
Symbol | 1-Month Return (%) | 3-Month Return (%) | 12-Month Return (%) | 3-Year Average Return (%) | 5-Year Average Return (%) | Expense Ratio (%) | Net Assets ($M) |
Calvert Green Bond A* | CGAFX | -2.67 | -2.25 | -12.09 | -2.46 | 0.19 | 0.73 | 73.7 |
Calvert Green Bond I* | CGBIX | -2.65 | -2.26 | -11.92 | -2.23 | 0.46 | 0.48 | 732.6 |
Calvert Green Bond R6* | CBGRX | -2.64 | -2.24 | -11.87 | -2.18 | 0.43 | 40 | |
Franklin Municipal Green Bond ETF | FLMB | -3.02 | -2.3 | -12.12 | -1.78 | 1.02 | 0.3 | 104.8 |
iShares USD Green Bond ETF^ | BGRN | -2.17 | -1.91 | -12.73 | -3.35 | 0.2 | 291.3 | |
Mirova Global Green Bond A* | MGGAX | -4.36 | -3.93 | -15.72 | -4.42 | -0.42 | 0.94 | 6.3 |
Mirova Global Green Bond N* | MGGNX | -4.45 | -3.92 | -15.56 | -4.17 | -0.15 | 0.64 | 4.9 |
Mirova Global Green Bond Y* | MGGYX | -4.46 | -3.92 | -15.61 | -4.21 | -0.18 | 0.69 | 28.9 |
PIMCO Climate Bond A* | PCEBX | -3.2 | -2.59 | -12.54 | 0.91 | 0.8 | ||
PIMCO Climate Bond C* | PCECX | -3.26 | -2.77 | -13.21 | 1.66 | 0 | ||
PIMCO Climate Bond I-2* | PCEPX | -3.17 | -2.52 | -12.28 | 0.61 | 0.5 | ||
PIMCO Climate Bond I-3* | PCEWX | -3.18 | -2.53 | -12.32 | 0.66 | 0.1 | ||
PIMCO Climate Bond Institutional* | PCEIX | -3.16 | -2.49 | -12.19 | 0.51 | 11 | ||
TIAA-CREF Green Bond Advisor* | TGRKX | -2.05 | -1.78 | -11.6 | -1.35 | 0.6 | 43.9 | |
TIAA-CREF Green Bond Institutional* | TGRNX | -1.94 | -1.67 | -11.48 | -1.3 | 0.45 | 73.2 | |
TIAA-CREF Green Bond Premier* | TGRLX | -1.96 | -1.71 | -11.61 | -1.42 | 0.6 | 0.9 | |
T TIAA-CREF Green Bond retail* | TGROX | -1.97 | -1.73 | -11.73 | -1.57 | 0.8 | 7.2 | |
TIAA-CREF Green Bond Retirement* | TGRMX | -1.96 | -1.71 | -11.62 | -1.43 | 0.7 | 14.2 | |
GRNB | -1.94 | -2.08 | -12.57 | -2.19 | -0.92 | 0.2 | 82.3 | |
Average/Total | -2.85 | -2.44 | -12.67 | -2.43 | 0.0 | |||
Bloomberg US Aggregate Bond Index | -2.83 | -2.01 | -11.52 | -2.0 | 0.52 | |||
Bloomberg Global Aggregate Bond Index | -3.95 | -5.05 | -17.61 | -4.39 | -1.46 | |||
Bloomberg Municipal Total Return Index | -2.19 | -1.25 | -8.63 | -0.83 | 1.28 | |||
S&P Green Bond US Dollar Select IX | -1.85 | -2.14 | -12.53 | -1.82 | 0.56 | |||
ICE BofAML Green Bond Index Hedged US Index | -4.47 | -3.01 | -15.12 | -4.05 | 0.29 |
Notes of Explanation: Blank cells=NA. 3 and 5-year returns are average annual total returns. *Fund invests in foreign currency bonds and performance should also be compared to a more narrowly based relevant index such as the ICE BofAML Green Blond Index Hedged US or equivalent. ** Fund invests in US dollar denominated green bonds only and performance should also be compared to a more narrowly based relevant index such as the S&P Green Bond US Dollar Select Index or equivalent. ^Effective March 1, 2022, fund shifted to US dollar green bonds. Fund total net assets and performance data source: Morningstar Direct; fund filings. Research and analysis by Sustainable Research and Analysis LLC


