The Bottom Line: Green bond funds held steady in 2022 and are expected to benefit from moderating conditions and increased sustainable bonds issuance in 2023.
December Summary
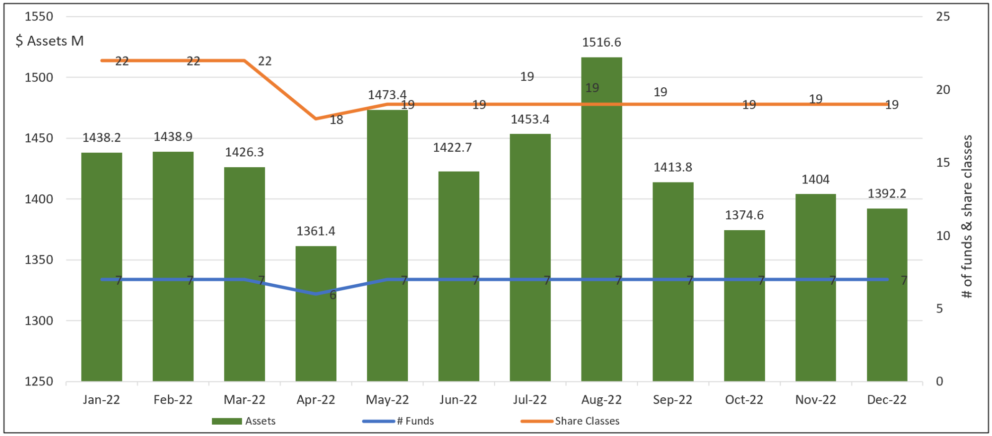
- Investors didn’t abandon green bond funds in 2022 even in the light of posting an average decline of 13.5%, excluding the Franklin Municipal Green Bond Fund (FLMB), versus a drop of 13.01% registered by the Bloomberg US Aggregate Bond Index. Green bond funds, the small segment of thematic bond funds consisting of four mutual funds and three ETFs that offer investors exposure to environmental projects and investments while seeking market-based returns, ended the year 2022 with $1,392.2 million in assets under management. This was down $11.8 million relative to November and lower by $88.6 million versus December 2021, due to market conditions, when green bond fund assets stood at $1,480.8 million. Refer to Chart 1.
- The ranking of the top three green bond funds by assets under management changed during the year. The Calvert Green Bond Fund and iShares USD Green Bond ETF (BGRN) remain the top two ranked funds, with year-end assets of $732.7 million and $291.1 million, respectively, but the TIAA-CREF Green Bond Fund gained ground and overtook the VanEck Green Bond Fund ETF (GRNB). The fund’s strong 3-year performance track record attracted institutional assets and led to an overall gain of $80.5 million in 2022, to end the year at $139 million.
- In calendar year 2022 the bond market went through a huge resetting of interest rates and performance results were the worst since the start of the Bloomberg US Aggregate Bond Index series that goes back to 1976. Against this backdrop, for investors who benchmark their fixed income positions to the same benchmark, the latest one month, one-year and three-year average performance results registered by taxable green bond funds are a disappointment. Excluding the Franklin Municipal Green Bond ETF, green bond funds recorded an average decline of -0.96% (-0.93% when FLMB is included); and for the calendar year and three-year intervals, green bond funds scored an average decline of 13.5% and 2.86%, respectively. That said, the TIAA-CREF Green Bond Fund posted the best results across its five share classes for the three-year interval, followed by the PIMCO Climate Bond Fund, the Calvert Green Bond Fund R6 (CBGRX) and VanEck Green Bond ETF. Relative to suitably matched narrowly based green bond indices the results are generally more favorable, as noted in Table 1.
- According to Refinitiv, global debt capital markets activity totaled $8.3 trillion in 2022, down 19% compared to 2021. Inflationary concerns, rising interest rates and geopolitical tensions dampened issuance in 2022. Green and other sustainable bonds were also impacted by the downturn and experienced a similar percentage decline. Sustainable bond issuance reached $843.5 billion according to the Climate Bond Initiative. Green bond issuance comprised just over half of labelled bond issuance in 2022 at $487.1 billion. Sustainability bonds added $166.4 billion, social bonds totaled $130.2 billion, sustainability linked bonds reached $76.3bn and transition bonds contributed $3.5 billion. According to a just issued Moody’s forecast, sustainable bond issuance, including green bonds, social bonds, sustainability bonds and sustainability-linked bonds, is expected to rise to $950 billion in 2023. Refer to Chart 2. That said, Sustainable Research and Analysis is more upbeat. Developments, such as a more optimistic outlook for global growth (per the IMF just upgraded global economic outlook for 2023), moderating inflation and interest rates, supportive policies and continued strong demand, a catch-up of postponed issuances from last year, increased sovereign issuances, potential relaxation of World Bank and IMF balance sheet practices, as well as the expansion in the “use of proceeds” bonds, are likely to overcome some constraints and push sustainable bond issuance beyond the $1 trillion level in 2023.
- For example, a new “use of proceeds” bond type, an orange bond, was issued in December of last year. The world’s first orange bond, the Impact Investment Exchange (IIX) Women’s Livelihood Bond 5 (WLB5), is named after the orange colorings of the UN’s Sustainable Development Goal 5 for gender equality with a mission to build a gender-empowered financial system. Using a gender-lens investing approach, bond proceeds will fund small businesses that empower approximately 300,000 women and girls in emerging markets across Asia and Africa. The WLB5 made it known that it intends to comply with existing standards including the International Capital Markets Association (ICMA) Sustainability Bond Guidelines and the ASEAN Social Bond Standards. On another front, just this past week, Brazil announced plans to issue its first-ever green bonds in 2023–giving a lift to potential sovereign issuances this year.
Chart 1: Green bond fund mutual funds & ETFs assets under management – 2022 Notes of Explanation: Data adjusted for the closing of the Franklin Municipal Green Blond Fund and its four share classes with total net assets of $9.7 million and the rebranded Franklin Liberty Federal Tax-Free Bond ETF, renamed the Franklin Municipal Green Bond ETF, as of May 3, 2022. Fund total net assets data source: Morningstar Direct; fund filings. Research and analysis by Sustainable Research and analysis LLC
Chart 2: Annual global sustainable bonds issuance: 2016 – 2023 (forecast) Notes of Explanation: Sustainable bonds include green bonds, social bonds, sustainability bonds and sustainability-linked bonds. Sources: Moody’s Investors and Environmental Finance Data.
Table 1: Green bond funds: Performance results, expense ratios and AUM – Dec. 31, 2022
Name | Symbol | 1-Month Return (%) | 3-Month Return (%) | 12-Month Return (%) | 3-Year Average Return (%) | 5-Year Average Return (%) | Expense Ratio (%) | Net Assets ($M) |
Calvert Green Bond A* | CGAFX | -1.11 | 1.31 | -13.01 | -3 | -0.23 | 0.73 | 67.1 |
Calvert Green Bond I* | CGBIX | -1.09 | 1.37 | -12.78 | -2.77 | 0.05 | 0.48 | 627.7 |
Calvert Green Bond R6* | CBGRX | -1.08 | 1.39 | -12.72 | -2.69 | 0.43 | 37.9 | |
Franklin Municipal Green Bond ETF@ | FLMB | -0.41 | 4.64 | 0.3 | 107.9 | |||
iShares USD Green Bond ETF^ | BGRN | -0.33 | 2.04 | -12.99 | -3.33 | 0.2 | 291.1 | |
Mirova Global Green Bond A* | MGGAX | -2.49 | 1.93 | -16.73 | -4.57 | -0.92 | 0.94 | 5.3 |
Mirova Global Green Bond N* | MGGNX | -2.47 | 2.05 | -16.42 | -4.28 | -0.62 | 0.64 | 5.2 |
Mirova Global Green Bond Y* | MGGYX | -2.36 | 2.05 | -16.45 | -4.28 | -0.66 | 0.69 | 25.8 |
PIMCO Climate Bond A* | PCEBX | -0.76 | 2.42 | -12.91 | -2.7 | 0.91 | 0.8 | |
PIMCO Climate Bond C* | PCECX | -0.83 | 2.22 | -13.57 | -3.44 | 1.66 | 0 | |
PIMCO Climate Bond I-2* | PCEPX | -0.73 | 2.49 | -12.65 | -2.42 | 0.61 | 0.4 | |
PIMCO Climate Bond I-3* | PCEWX | -0.73 | 2.48 | -12.69 | -2.46 | 0.66 | 0.1 | |
PIMCO Climate Bond Institutional* | PCEIX | -0.72 | 2.52 | -12.56 | -2.31 | 0.51 | 10.4 | |
TIAA-CREF Green Bond Advisor* | TGRKX | -0.53 | 1.53 | -13.02 | -2.09 | 0.6 | 42.7 | |
TIAA-CREF Green Bond Institutional* | TGRNX | -0.52 | 1.55 | -12.98 | -2.07 | 0.45 | 74.5 | |
TIAA-CREF Green Bond Premier* | TGRLX | -0.53 | 1.51 | -13.11 | -2.19 | 0.6 | 0.9 | |
T TIAA-CREF Green Bond retail* | TGROX | -0.55 | 1.47 | -13.23 | -2.34 | 0.8 | 7.2 | |
TIAA-CREF Green Bond Retirement* | TGRMX | -0.54 | 1.51 | -13.12 | -2.2 | 0.7 | 13.7 | |
GRNB | 0.05 | 2.66 | -11.86 | -2.41 | -1.21 | 0.2 | 73.5 | |
Average/Total+ | 0.96 | 1.92 | -13.5 | -2.86 | -0.48 | 0.64 | 1,392.2 | |
Bloomberg US Aggregate Bond Index | -0,45 | 1.87 | -13.01 | -2.71 | 0.02 | |||
Bloomberg Global Aggregate Bond Index | 0.54 | 4.55 | -16.25 | -4.48 | -1.66 | |||
Bloomberg Municipal Total Return Index | 0.29 | 4.1 | -8.53 | -0.77 | 1.25 | |||
S&P Green Bond US Dollar Select IX | -0.03 | 2.55 | -12.14 | -6.95 | -3.76 | |||
ICE BofAML Green Bond Index Hedged US Index | -2.46 | 0.98 | -16.74 | -4.58 | -0.48 |
Notes of Explanation: Blank cells=NA. 3 and 5-year returns are average annual total returns. +Average returns apply to taxable funds only and excludes Franklin Municipal Green Bond ETF. If Franklin is included, results are 0.93% in December and 2.06% over the trailing 3-months. *Fund invests in foreign currency bonds and performance should also be compared to a more narrowly based relevant index such as the ICE BofAML Green Blond Index Hedged US or equivalent. ** Fund invests in US dollar denominated green bonds only and performance should also be compared to a more narrowly based relevant index such as the S&P Green Bond US Dollar Select Index or equivalent. @Fund rebranded as of May 3, 2022. ^Effective March 1, 2022, fund shifted to US dollar green bonds. ^^As of September 3, 2019, the fund shifted to US dollar green bonds tracks the S&P Green Bond U.S. Dollar Select Index. Fund total net assets and performance data source: Morningstar Direct; fund filings. Research and analysis by Sustainable Research and Analysis LLC.


