The Bottom Line: Green bond funds sustained their worst monthly decline in net assets while preliminary green bonds issuance data in September show another again.
September Summary
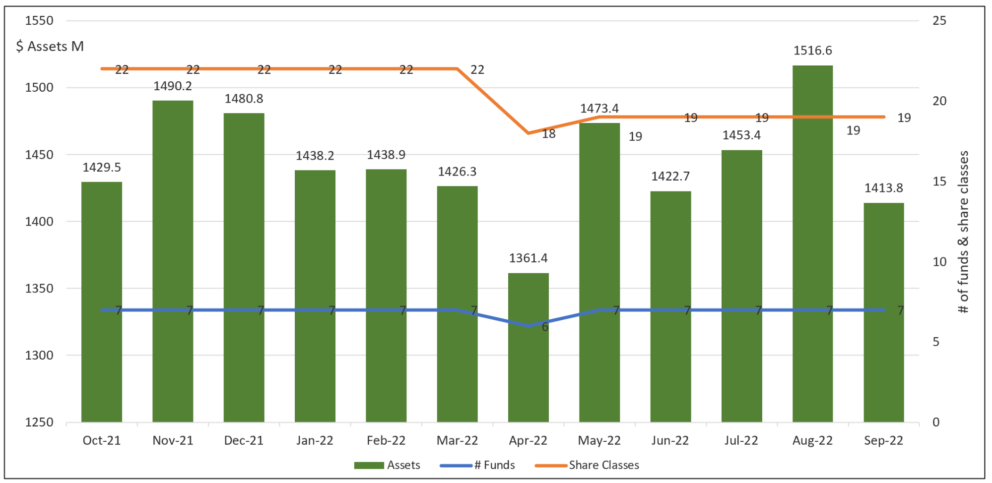
- The segment of green bond funds, consisting of four mutual funds and three ETFs, sustained its worst monthly decline in net assets in September. Net assets dropped by $102.8 million to reach $1,413.8 million. Market deprecation in September accounted for an estimated $57.7 million while redemptions hit $45.1 million. This occurred immediately following the best month-over-month gain in net assets so far this year with an increase $63.2 million in August even on the back of negative performance results. Refer to Chart 1.
- Three-quarters of the assets decline in September was attributable to the Calvert Green Bond Fund. This $769.3 million fund gave up $77 million in net assets, down from $846.3 million the previous month. The decline was almost entirely linked to the institutional oriented Calvert Green Bond I (CGBIX). The second largest net decline in assets was experienced by the iShares USD Green Bond ETF (BGRN) that gave up $11.2 million.
- The reality of higher interest rates and high inflation fueled by high employment and strong demand triggered a fall of 9.21% in the S&P 500 Index (large and mid-cap companies) in September while the Bloomberg US Aggregate Bond Index gave up 3.48%. During the same interval, green bond funds posted an average decline of 4.08%, or slightly better than the -4.32% recorded by the Bloomberg US Aggregate Bond Index and an even wider 27 bps differential when the Franklin Municipal Bond ETF, a fund that seeks to maximize income exempt from federal income taxes that was down 4.72%, is excluded. The Calvert Bond Fund with its three share classes posted the best results in September, dropping between 3.58% and 3.68%. At the other end of the range is the Mirova Global Green Bond Fund that recorded declines ranging from -4.56% to 4.43%, depending on share class. Refer to Table 1.
- The Mirova Global Green Bond Fund was also a laggard over the trailing twelve months during which time the small universe of green bond funds registered an average decline of -15.61%. The average decline was wider than the Bloomberg Aggregate Bond Index, -14.6%, but significantly ahead of the Bloomberg Global Aggregate Bond Index, down 20.43%, and the ICE BofAML Green Bond Index Hedged US Index, -17.78%.
- Two active funds, the Calvert Green Bond Fund (two of three share classes) and TIAA-CREF Green Bond Fund (two of five share classes), produced average 12-month results that bettered the Bloomberg US Aggregate Bond Index. Otherwise, green bond funds did not provide a cushion from volatility that permeated the conventional bond market.
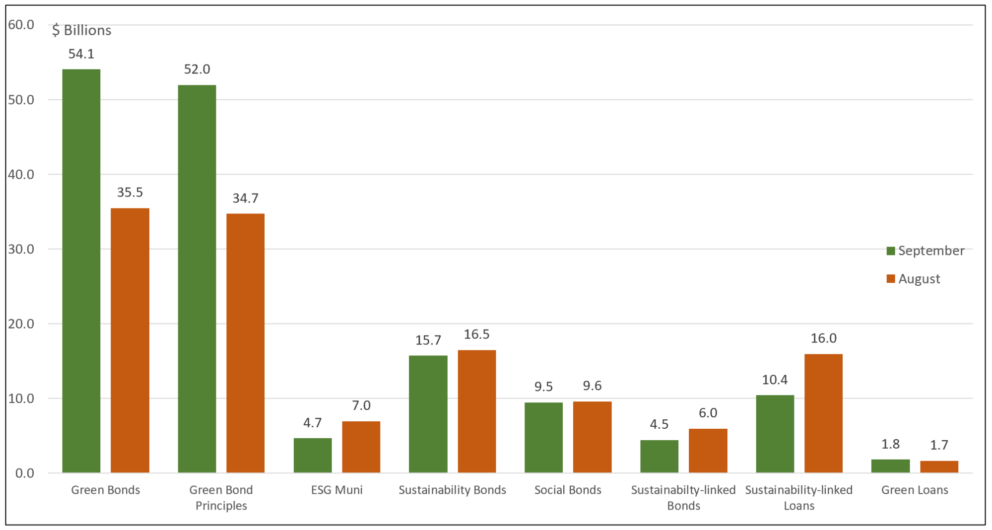
- According to reporting by Bloomberg on a preliminary basis, global sales of green bonds rose for a second straight month in September to the highest level since May, even against a backdrop of heightened volatility in the broader market. Green bonds issuance in September sourced to companies and governments around the world, according to Bloomberg, reached an estimated $54.05 billion versus $35.5 billion raised in August. Refer to Chart 2. Based on September’s volume, year-to-date issuance reached an estimated $395.8 billion for an estimated 11% drop compared to last year over the same period. At the same time, global sales of social, sustainability and sustainability-linked debt declined in September.
- Not counted in the above numbers is the noteworthy $500 million 100-year green bond tranche issued by the Saudi Arabia Public Investment Fund (PIF) and guaranteed by GACI First Investment Company which raised a total of $3 billion after the close of the third quarter on October 5, 2022. The bonds were issued in line with the Green Bond Principles maintained by the International Capital Markets Association, the proceeds will be used to finance, refinance and/or invest in eligible green projects that, according to the Offering Circular, are aligned with the United Nations Sustainable Development Goals and are expected to include renewable energy, energy efficiency, sustainable water management, pollution prevention and control, green buildings and clean transportation. The bonds also received a second party opinion by DNV Business Assurance Services UK Limited. While not assured, the bonds are also in line to receive a Climate Bond Initiative certification based on the Climate Bond Standard.
- This very long dated PIF green bond transaction appears to satisfy the generally accepted criteria for qualifying green bonds. At the same time, beyond the various other issue and issuer-specific financial risks enumerated in the Offering Circular, the PIF offering is likely to have been problematic for values-based investors. This is due to the sovereign wealth fund’s indirect exposure to Saudi Arabia, even as the fund itself is quite diversified and many of the sectors where PIF invests have low exposure to environmental and social risks. Saudi Arabia scores poorly on governance due to the country’s low ranking on factors the include ease of doing business, rule of law, press freedom and political rights which have been suppressed, as shown in very stark terms by the killing of Saudi columnist Jamal Khashoggi back in October 2018. Also, Saudi Arabia is highly exposed to carbon transition risk due to its economic and fiscal dependence on the hydrocarbon sector, it faces increased challenges surrounding water sustainability that are exacerbated by a rapid population growth in recent years, and its exposure to various social risks, including the country’s high levels of gender inequality. Admittedly, some of these considerations are being mitigated by the country’s long-term commitment to energy transition, but it was also just a short five days following the issuance of the bonds that Saudi Arabia agreed along with other OPEC+ nations to cut oil production, potentially contributing to pain and instability in Europe this coming winter. In the end, the combined offering was assigned high investment-grade ratings of A1 by Moody’s Investors and an A rating by Fitch Ratings and the transaction was reported to have received final orders that totaled around $25 billion.
Chart 1: Green bond mutual funds and ETFs and assets under management – September 2021 – September 30, 2022 Notes of Explanation: Franklin Municipal Green Blond Fund and tis four share classes with total net assets of $9.7 million included in the data. At the same time, the rebranded Franklin Liberty Federal Tax-Free Bond ETF renamed the Franklin Municipal Green Bond ETF is excluded as of April 29, 2022. Fund total net assets data source: Morningstar Direct; fund filings. Research and analysis by Sustainable Research and analysis LLC
Chart 2: Month-over-month issuance of green and sustainable bonds–September 2022 Notes of Explanation: Source: Bloomberg
Table 1: Green bond funds: Performance results, expense ratios and AUM-Sept. 30, 2022
Name | Symbol | 1-Month Return (%) | 3-Month Return (%) | 12-Month Return (%) | 3-Year Average Return (%) | 5-Year Average Return (%) | Expense Ratio (%) | Net Assets ($M) |
Calvert Green Bond A* | CGAFX | -3.68 | -3.51 | -14.68 | -3.46 | -0.46 | 0.73 | 70.9 |
Calvert Green Bond I* | CGBIX | -3.59 | -3.45 | -14.44 | -3.21 | -0.18 | 0.48 | 660.3 |
Calvert Green Bond R6* | CBGRX | -3.58 | -3.43 | -14.39 | -3.16 | 0.43 | 38.1 | |
Franklin Municipal Green Bond ETF@ | FLMB | -4.72 | -4.53 |
|
| 0.3 | 99.6 | |
iShares USD Green Bond ETF^ | BGRN | -3.84 | -3.95 | -15.05 | -4.37 | 0.2 | 279.4 | |
Mirova Global Green Bond A* | MGGAX | -4.56 | -4.67 | -18.95 | -5.58 | -1.24 | 0.94 | 5.8 |
Mirova Global Green Bond N* | MGGNX | -4.43 | -4.54 | -18.68 | -5.3 | -0.93 | 0.64 | 4.6 |
Mirova Global Green Bond Y* | MGGYX | -4.43 | -4.55 | -18.71 | -5.35 | -0.99 | 0.69 | 27.9 |
PIMCO Climate Bond A* | PCEBX | -4.08 | -4.09 | -15.64 | 0.91 | 0.8 | ||
PIMCO Climate Bond C* | PCECX | -4.14 | -4.28 | -16.28 | 1.66 | 0 | ||
PIMCO Climate Bond I-2* | PCEPX | -4.05 | -4.02 | -15.38 | 0.61 | 0.5 | ||
PIMCO Climate Bond I-3* | PCEWX | -4.05 | -4.03 | -15.42 | 0.66 | 0.1 | ||
PIMCO Climate Bond Institutional* | PCEIX | -4.04 | -3.99 | -15.29 | 0.51 | 11 | ||
TIAA-CREF Green Bond Advisor* | TGRKX | -4.03 | -3.95 | -14.53 | -2.55 | 0.6 | 44.1 | |
TIAA-CREF Green Bond Institutional* | TGRNX | -4.12 | -3.94 | -14.5 | -2.53 | 0.45 | 70.4 | |
TIAA-CREF Green Bond Premier* | TGRLX | -4.14 | -3.98 | -14.63 | -2.66 | 0.6 | 0.9 | |
T TIAA-CREF Green Bond retail* | TGROX | -4.15 | -4.01 | -14.74 | -2.8 | 0.8 | 6.9 | |
TIAA-CREF Green Bond Retirement* | TGRMX | -4.14 | -3.98 | -14.63 | -2.66 | 0.7 | 13.5 | |
GRNB | -3.79 | -3.74 | -14.98 | -3.2 | -1.52 | 0.2 | 79 | |
Average/Total | -4.08 | -4.03 | -15.61 | -3.60 | -3.56 | 0.64 | 1,413.8 | |
Bloomberg US Aggregate Bond Index | -4.32 | -4.75 | -14.6 | -3.26 | -0.27 | |||
Bloomberg Global Aggregate Bond Index | -5.14 | -6.94 | -20.43 | -5.47 | -2.32 | |||
Bloomberg Municipal Total Return Index | -3.84 | -3.46 | -11.5 | -1.85 | 0.59 | |||
S&P Green Bond US Dollar Select IX | -3.89 | -3.81 | -15.06 | -2.96 | -0.17 | |||
ICE BofAML Green Bond Index Hedged US Index | -4.32 | -4.52 | -17.78 | -5.22 | -0.52 |
Notes of Explanation: Blank cells=NA. 3 and 5-year returns are average annual total returns. *Fund invests in foreign currency bonds and performance should also be compared to a more narrowly based relevant index such as the ICE BofAML Green Blond Index Hedged US or equivalent. ** Fund invests in US dollar denominated green bonds only and performance should also be compared to a more narrowly based relevant index such as the S&P Green Bond US Dollar Select Index or equivalent. @Fund rebranded as of May 3, 2022. ^Effective March 1, 2022, fund shifted to US dollar green bonds. Fund total net assets and performance data source: Morningstar Direct; fund filings. Research and analysis by Sustainable Research and Analysis LLC


