The Bottom Line: April 2023 green bond fund performance results favored passively managed funds investing in US dollar denominated securities and featuring low expense ratios.
Observations:
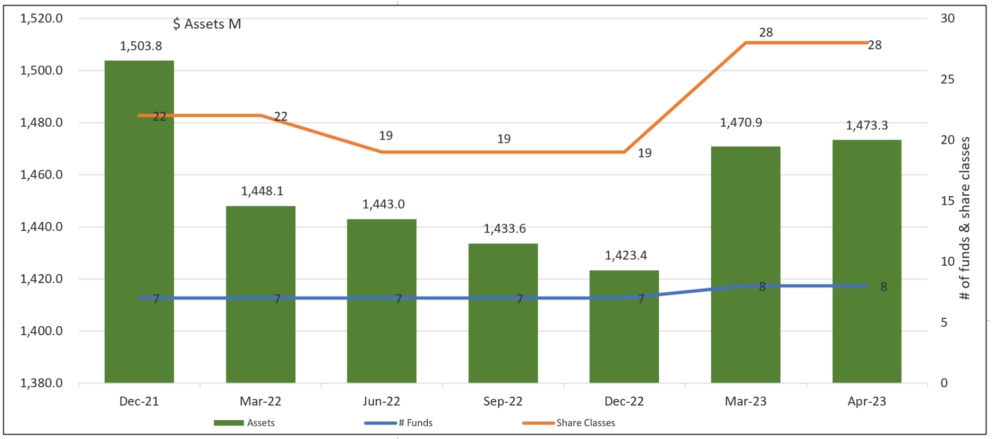
- Green bond funds, the segment of thematic bond funds consisting of five mutual funds/28 share classes and three ETFs that offer investors exposure to environmental projects and investments while seeking market-based returns, principally by investing in green bonds, added $2.4 million, or a month-over-month increase of 0.2%. Year-to-date, green bond fund assets expanded by $49.9 million, exceeding the gains achieved via capital appreciation. That said, green bond fund assets under management have still not fully recovered from the month-end peak reached in August 2022 when assets recorded $1,516.0 million. Refer to Chart 1.
- Retroactively added to the universe of green bond funds is the $18.8 million Lord Abbett Climate Focused Bond Fund with its nine share classes launched in May 2020. The fund, which focuses on achieving a total return, invests in the investment and non-investment grade securities of issuers that have or will have, a positive impact on the climate through an issuer’s operations or the products and services provided by the issuer. The fund does not limit its investments to labelled green bonds and also accounts for ESG factors.
- The green bond funds segment remains concentrated. The three largest funds, the Calvert Green Bond Fund, iShares USD Green Bond ETF and the TIAA-CREF Green Bond Fund, make up 83% of the segment’s assets under management. The net assets invested in the Calvert Green Bond Fund declined by $5.1 million in April while the other two funds added $4.2 million and $0.7 million, respectively.
- All green bond funds recorded positive rates of return since the start of the year. With an average gain of 0.58% in April, with all but two share classes subject to the highest expense ratios, outperforming conventional benchmarks. Results in April ranged from a high of 0.92% registered by the VanEck Green Bond Fund ETF and 0.89% posted by the iShares USD Green Bond ETF. In addition to restricting themselves to US dollar denominated green bonds, the two ETFs feature the lowest expense ratios at 0.2%. The poorest taxable fund performer in April, excluding the Franklin Municipal Green Bond ETF that gained 0.14%, was the Lord Abbett Climate Focused Bond Fund C shares that gained 0.42%. The share class was hampered by its 1.29% expense ratio. Refer to Table 1.
- On a year-to-date basis with an average return of 3.32%, 50% of funds/share classes outperformed their conventional benchmarks. On the other hand, trailing twelve month and three-year average returns are still negative at -1.80% and -2.01%, as the bond market is still recovering from the huge resetting of interest rates in 2022 and performance results that were the worst since the start of the Bloomberg US Aggregate Bond Index series that goes back to 1976.
- Excluding the municipal Franklin Municipal Green Bond ETF, the taxable segment gained 0.60% and 3.30% year-to-date.
- The average expense ratio applicable to the green bonds segment is 0.64%, ranging from a low of 0.20% levied by the two ETFs that have been in operation for over three years, to a high of 1.66%.
Chart 1: Green bond fund mutual funds & ETFs assets under management: 12/21 – 4/23 Notes of Explanation: Data adjusted for (1) The closing of the Franklin Municipal Green Blond Fund and its four share classes with total net assets of $9.7 million and the rebranded Franklin Liberty Federal Tax-Free Bond ETF, renamed the Franklin Municipal Green Bond ETF, as of May 3, 2022, and (2) Retroactively adding the Lord Abbett Climate Focused Bond Fund, launched in May 2020. Fund total net assets data source: Morningstar Direct; fund filings. Research and analysis by Sustainable Research and analysis LLC
Table 1: Green bond funds: Performance results, expense ratios and AUM – April 30, 2022
Fund Name | 1-M Return (%) | 3-M Return (%) | 12-M Return (%) | 3-Year Return (%) |
$AUM | Expense Ratio (%) |
Calvert Green Bond A | 0.84 | 3.49 | -1.36 | -2.36 | 69.4 | 0.73 |
Calvert Green Bond I | 0.86 | 3.57 | -1.11 | -2.11 | 652.9 | 0.48 |
Calvert Green Bond R6 | 0.86 | 3.58 | -1.05 | -2.06 | 40.7 | 0.43 |
Franklin Municipal Green Bond ETF@ | 0.14 | 3.65 | 112.1 | 0.3 | ||
iShares USD Green Bond ETF**/^^ | 0.89 | 3.68 | 0.29 | -2.72 | 308.7 | 0.2 |
Lord Abbett Climate Focused Bond A | 0.47 | 2.89 | -2.2 | 4.9 | 0.65 | |
Lord Abbett Climate Focused Bond C | 0.42 | 2.69 | -2.8 | 0.4 | 1.29 | |
Lord Abbett Climate Focused Bond F | 0.49 | 2.96 | -2 | 3.9 | 0.45 | |
Lord Abbett Climate Focused Bond F3 | 0.49 | 2.96 | -1.96 | 0.1 | 0.44 | |
Lord Abbett Climate Focused Bond I | 0.61 | 3.09 | -1.88 | 9 | 0.45 | |
Lord Abbett Climate Focused Bond R3 | 0.45 | 2.79 | -2.49 | 0 | 0.95 | |
Lord Abbett Climate Focused Bond R4 | 0.47 | 2.88 | -2.24 | 0 | 0.7 | |
Lord Abbett Climate Focused Bond R5 | 0.49 | 2.96 | -2 | 0 | 0.45 | |
Lord Abbett Climate Focused Bond R6 | 0.49 | 2.96 | -1.97 | 0.5 | 0.44 | |
Mirova Global Green Bond A | 0.49 | 2.88 | -5.34 | -3.96 | 5.1 | 0.91 |
Mirova Global Green Bond N | 0.49 | 2.86 | -5.1 | -3.69 | 6 | 0.61 |
Mirova Global Green Bond Y | 0.49 | 2.86 | -5.1 | -3.72 | 26.5 | 0.66 |
PIMCO Climate Bond A | 0.66 | 3.6 | -1.35 | -1.07 | 1 | 0.91 |
PIMCO Climate Bond C | 0.6 | 3.35 | -2.09 | -1.82 | 0 | 1.66 |
PIMCO Climate Bond I-2 | 0.68 | 3.7 | -1.06 | -0.78 | 0.4 | 0.61 |
PIMCO Climate Bond I-3 | 0.68 | 3.68 | -1.11 | -0.83 | 0.1 | 0.66 |
PIMCO Climate Bond Institutional | 0.69 | 3.73 | -0.96 | -0.68 | 11.9 | 0.51 |
TIAA-CREF Green Bond Advisor | 0.44 | 3.64 | -0.88 | -1.6 | 43.9 | 0.6 |
TIAA-CREF Green Bond Institutional | 0.56 | 3.79 | -0.69 | -1.53 | 77.2 | 0.45 |
TIAA-CREF Green Bond Premier | 0.54 | 3.74 | -0.85 | -1.66 | 0.9 | 0.6 |
TIAA-CREF Green Bond Retail | 0.53 | 3.69 | -0.99 | -1.84 | 7.8 | 0.8 |
TIAA-CREF Green Bond Retirement | 0.54 | 3.73 | -0.86 | -1.69 | 14.4 | 0.7 |
0.92 | 3.47 | 0.42 | -2.09 | 75.5 | 0.2 | |
Averages+/Total | 0.58 | 3.32 | -1.80 | -2.01 | 1,473.3 | 0.64 |
Bloomberg US Aggregate Bond Index | 0.61 | 3.59 | -0.43 | -3.15 | ||
Bloomberg Global Aggregate Bond Index | 0.44 | 3.46 | -2.31 | -3.91 | ||
Bloomberg Municipal Total Return Index | -0.23 | 2.45 | 2.87 | 0.70 | ||
S&P Green Bond US Dollar Select IX | 0.92 | 3.56 | 0.29 | -1.81 | ||
ICE BofAML Green Bond Index Hedged US Index | 0.59 | 3.26 | -4.55 | -3.99 |
Notes of Explanation: Blank cells=NA. 3-year returns are average annual total returns. +Average returns apply to taxable as well as municipal green bond funds. If the municipal Franklin Municipal Green Blond ETF is excluded, results are 0.60% in April and 3.30% Y-T-D. 12-M and 3-Year results are not impacted. ** Fund invests in US dollar denominated green bonds only and performance should also be compared to a more narrowly based relevant index such as the S&P Green Bond US Dollar Select Index or equivalent. Unless otherwise noted, fund invests in foreign currency bonds and performance should also be compared to a more narrowly based relevant index such as the ICE BofAML Green Blond Index Hedged US or equivalent. @Fund rebranded as of May 3, 2022. ^Effective March 1, 2022, fund shifted to US dollar green bonds. ^^As of September 3, 2019, the fund shifted to US dollar green bonds and tracks the S&P Green Bond U.S. Dollar Select Index. Fund total net assets and performance data source: Morningstar Direct; fund filings. Research and analysis by Sustainable Research and Analysis LLC.


