The bottom line: A newly launched green bond ETF expands segment, giving investors another sustainable bond fund option to consider in their core bond segment.
Support endures for green bond mutual funds and ETFs
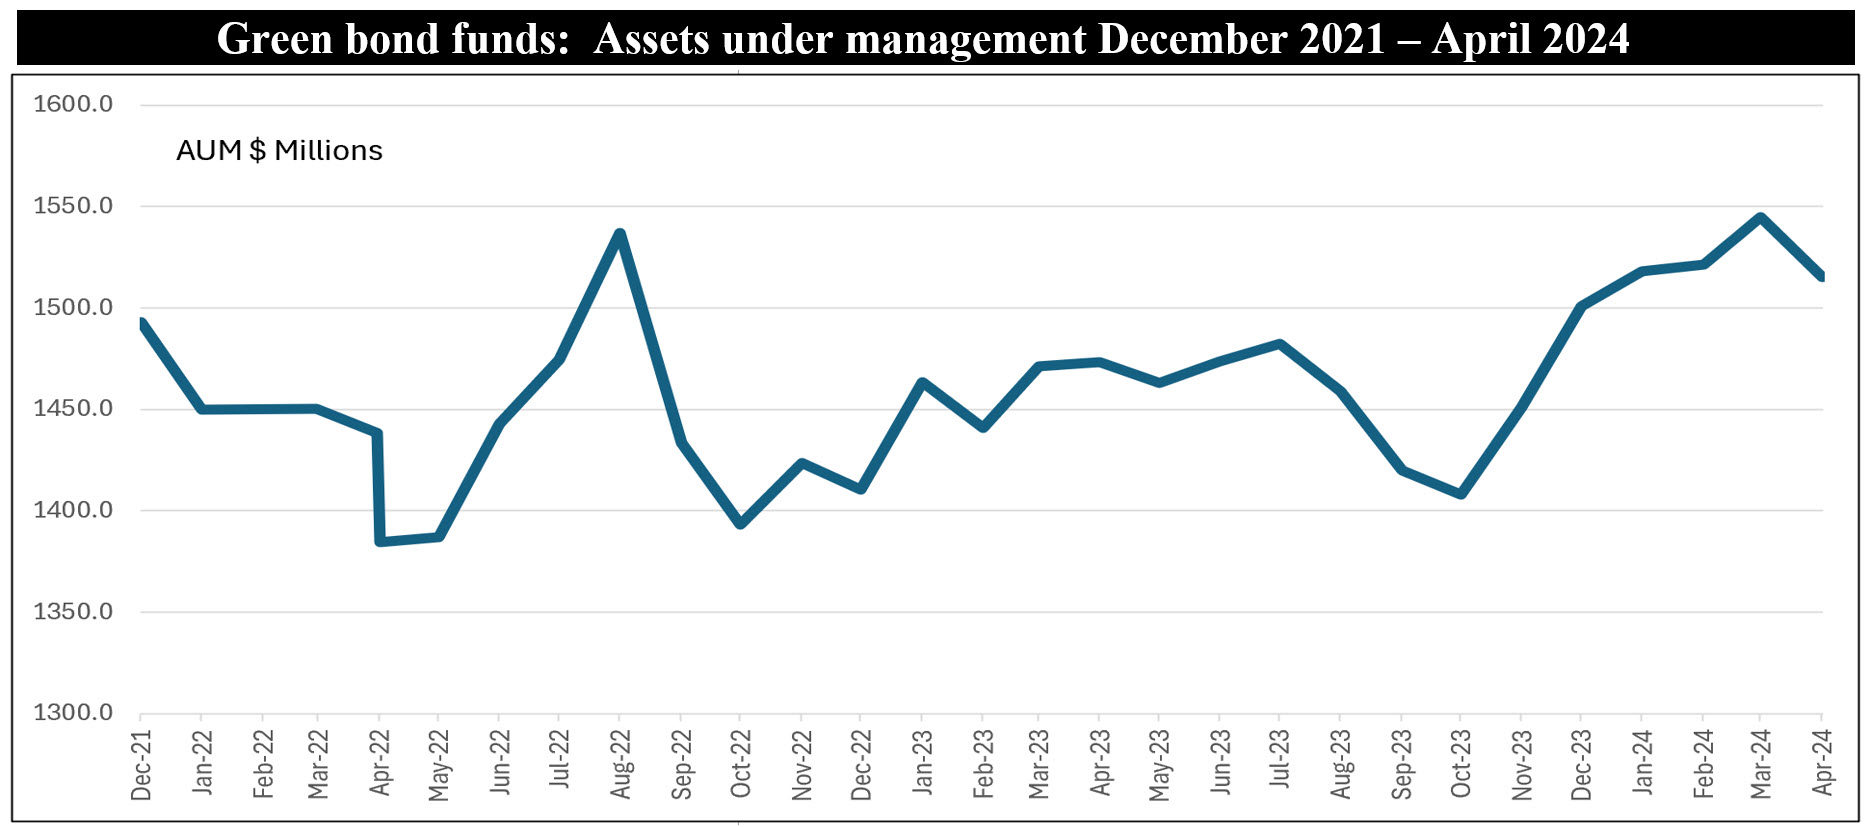
A signal in support of green bond funds was on display last month when a new green bond fund, the Carbon Collective Short Duration Green Bond ETF (CCSB), was launched by Tidal Investments LLC. Elevating the number of green bond funds to nine, including 29 share classes, this was the first green bond fund to be introduced since the rebranding as of May 3, 2022 of the Franklin Liberty Federal Tax-Free Bond ETF, renamed the Franklin Municipal Green Bond ETF (FLMB). With the addition of CCSB’s $10 million in net assets, green bond funds reached $1.52 billion at the end of April. Another important factor that shows continuing support for green bond funds has been the stickiness of institutional investors who dominate this small thematic category of sustainable funds and a growing but smaller retail investor base. Challenging as the bond markets have been in recent years, the positive relative performance results achieved by green bond funds, as compared to the broad-based Bloomberg US Aggregate Bond Index consisting of investment-grade intermediate government and corporate bonds, indicates that green bond funds can have an additive role in the core bond segment of a sustainable investment portfolio and also conventional portfolios
Expanding to nine green bond funds, the segment offers investors additional investment options
Now consisting of nine green bond funds, the segment is dominated by five firms with their mutual funds and ETF offerings, each of which is close to or in excess of $100 million in net assets. These include the Calvert Green Bond Fund (CGBIX) with $734.8 million in net assets, or 48% of the category’s total net assets, followed by iShares USD Green Bond ETF (BGRN), Nuveen Green Bond Fund (TGRNX) with its four share classes, Franklin Municipal Green Bond ETF (FLMB) and the VanEck Green Bond ETF (GRNB), with $346 million, $180.3 million, $110.1 and $91.7 million, respectively (Note: Ticker symbols for mutual funds apply to largest share class). Together, these five firms manage almost $1.5 billion or 96% of the category’s total net assets. While each of the funds invests in green investments, their structures and approaches vary in the way the portfolios are managed. In addition to the distinction between mutual funds and ETFs, active versus passive management as well as variations in expense ratios, key areas of differentiation revolve around fundamental investment strategies, such as credit quality and duration characteristics, the definition and qualification of green investments and the adoption of broader sustainable investing strategies. The Carbon Collective Short Duration Green Bond ETF expands upon the current batch of offerings by restricting the duration of individual securities as well as the average duration of the portfolio to less than five years, and by selecting bonds based on their ability in the aggregate “to achieve a weighted average avoided/reduced CO2e e(or carbon yield) of >400 MT per $1 million invested.” In addition, the fund will not invest in the bonds of any companies that derive 10% or more of their revenue from the production of fossil fuels, defense, weapons and private prisons.
While gradually increasing, assets under management have remained within a stable band
Assets under management attributable to the nine green bond funds reached $1.52 billion at the end of April, up from $1.50 billion at year-end 2023, for a limited increase of $14.3 million. Assets under management have gradually increased over the last two or so years due to positive cash flows but have remained within a band that, since the end of 2021, has fluctuated between a low of $1.4 billion and $1.5 billion in net assets¹. This relative stability in the light of challenging bond market conditions is in no small part attributable to the role of more stable long-term sustainability oriented institutional investors who continue to dominate the green bond funds investor base and a growing but small retail investor base. While it’s possible to track institutional holdings in ETFs through 13-F filings, institutional ownership can be more readily identified in mutual funds via their institutional share classes. As of April 2024, institutional shareholders account for $711 million or 74% of assets under management.

Notes of Explanation: The rebranded Franklin Municipal Green Bond Fund reflected, starting May 3, 2022. Sources: Morningstar Direct; Sustainable Research and Analysis LLC
Performance results: Average performance has exceeded the broad investment grade intermediate benchmark
The last three calendar years have been particularly challenging for fixed income investors, in large part due to rising interest rates and inflation. Against this backdrop, the relative performance results achieved by green bond funds versus the Bloomberg US Aggregate Bond Index²–the most widely used benchmark for the bond market in the US–have been positive over varying periods during the past five years. At the same time, green bond funds, on average, have exhibited lower levels of volatility. For these reasons, it’s reasonable to argue that green bond funds can serve as a complement in the core fixed income component of a diversified portfolio to advance investor preferences for “green investments” without giving up any financial returns. This could also be the case for conventional portfolios.
In the short-term, including time periods up to and including three years, green bond funds, on average, have outperformed the Bloomberg US Aggregate Bond Index. In April, the eight funds in operation during the entire month along with their corresponding share classes, where applicable, posted an average return of -1.6% for a 93-basis points advantage over the Bloomberg US Aggregate Bond Index. Returns in April ranged from a low of -2.32% to a high of -1.14%. All 28 funds/share classes in operation during the entire month outperformed the benchmark but differences in results are, in part, attributable to variations in expense ratios. For green bond funds, these range from a low of 0.2% to a high of 1.74%. With a median expense ratio of 0.6%, paying higher fees should be carefully considered.
Green bond funds, on average, also outperformed the conventional benchmark year-to-date, trailing twelve months and three years, with margins of 1.79%, 4.34% and 1.06%, respectively.
|
Green bond funds: Performance results to April 2024, assets and expense ratios |
|
Mutual Fund/ETF |
1-M (TR%) |
Y-T-D (TR%) |
12-M (TR%) |
3-YR (TR%) |
5-YR (TR%) |
AUM $ M |
Expense Ratio (%) |
|
Calvert Green Bond A |
-2.32 |
-2.67 |
0.29 |
-3.34 |
-0.13 |
66.6 |
0.73 |
|
Calvert Green Bond I |
-2.3 |
-2.59 |
0.55 |
-3.09 |
0.12 |
620.6 |
0.48 |
|
Calvert Green Bond R6 |
-2.29 |
-2.57 |
0.6 |
-3.04 |
0.19 |
47.6 |
0.43 |
|
Carbon Collective Short Dur Grn Bd ETF |
10 |
0.5 |
|||||
|
Franklin Municipal Green Bond ETF |
-1.16 |
-0.94 |
2.95 |
# |
# |
110.1 |
0.3 |
|
iShares USD Green Bond ETF |
-1.69 |
-1.79 |
0.9 |
-3.01 |
-0.15 |
346 |
0.2 |
|
Lord Abbett Climate Focused Bond A |
-1.28 |
-1.17 |
4.14 |
-1.83 |
5.4 |
0.65 |
|
|
Lord Abbett Climate Focused Bond C |
-1.33 |
-1.36 |
3.51 |
-2.45 |
0.4 |
1.26 |
|
|
Lord Abbett Climate Focused Bond F |
-1.26 |
-1.1 |
4.35 |
-1.63 |
2.6 |
0.45 |
|
|
Lord Abbett Climate Focused Bond F3 |
-1.26 |
-1.1 |
4.36 |
-1.59 |
0.1 |
0.43 |
|
|
Lord Abbett Climate Focused Bond I |
-1.26 |
-1.1 |
4.22 |
-1.63 |
12 |
0.45 |
|
|
Lord Abbett Climate Focused Bond R3 |
-1.3 |
-1.26 |
3.84 |
-2.12 |
0 |
0.95 |
|
|
Lord Abbett Climate Focused Bond R4 |
-1.28 |
-1.18 |
4.09 |
-1.87 |
0 |
0.7 |
|
|
Lord Abbett Climate Focused Bond R5 |
-1.26 |
-1.1 |
4.35 |
-1.63 |
0 |
0.45 |
|
|
Lord Abbett Climate Focused Bond R6 |
-1.14 |
-1.09 |
4.37 |
-1.59 |
0.5 |
0.43 |
|
|
Mirova Global Green Bond A |
-1.77 |
-2.12 |
3.21 |
-4.29 |
-0.67 |
5.3 |
0.93 |
|
Mirova Global Green Bond N |
-1.64 |
-1.99 |
3.61 |
-3.98 |
-0.37 |
7.7 |
0.62 |
|
Mirova Global Green Bond Y |
-1.65 |
-1.99 |
3.56 |
-4.01 |
-0.39 |
27 |
0.68 |
|
Nuveen Green Bond A |
-2.15 |
-1.92 |
0.37 |
-3.01 |
0.34 |
7.1 |
0.8 |
|
Nuveen Green Bond I |
-2.14 |
-1.75 |
0.7 |
-2.79 |
0.58 |
35.6 |
0.6 |
|
Nuveen Green Bond Premier |
-2.14 |
-1.87 |
0.53 |
-2.87 |
0.49 |
0.9 |
0.6 |
|
Nuveen Green Bond R6 |
-2.13 |
-1.82 |
0.68 |
-2.73 |
0.62 |
96.5 |
0.45 |
|
Nuveen Green Bond Retirement |
-2.15 |
-1.9 |
0.43 |
-2.91 |
0.46 |
13.2 |
0.7 |
|
PIMCO Climate Bond A |
-1.68 |
-1.46 |
3.09 |
-2.26 |
1.4 |
0.99 |
|
|
PIMCO Climate Bond C |
-1.74 |
-1.71 |
2.32 |
-3 |
0.1 |
1.74 |
|
|
PIMCO Climate Bond I-2 |
-1.65 |
-1.37 |
3.4 |
-1.97 |
0.2 |
0.69 |
|
|
PIMCO Climate Bond I-3 |
-1.66 |
-1.38 |
3.35 |
-2.02 |
0.4 |
0.74 |
|
|
PIMCO Climate Bond Institutional |
-1.64 |
-1.33 |
3.5 |
-1.87 |
16 |
0.59 |
|
|
-1.63 |
-1.42 |
1.89 |
-2.46 |
0.3 |
91.7 |
0.2 |
|
|
Average/Total |
-1.60 |
-1.49 |
2.87 |
-2.48 |
0.12 |
1525 |
0.65 |
|
Bloomberg US Aggregate Bond Index |
-2.53 |
-3.28 |
-1.47 |
-3.54 |
-0.16 |
Notes of Explanation: # Fund rebranded as of May 3, 2022 and prior performance does not reflect a track record in green bond investing. Sources: Morningstar Direct; Sustainable Research and Analysis LLC
¹ Adjustments have not been made for the rebranded $100 million Franklin Municipal Green Bond Fund. ² More narrowly focused benchmarks may be more appropriate to evaluate individual manager performance. For example, an index tracking a universe of US and non-US securities will be appropriate for the Calvert Breen Bond Fund while a municipal bond index would be most relevant for the Franklin Municipal Bond Index.


