The Bottom Line: New carbon credit futures investment options posted outstanding 2021 results and diverged in 2022, but a long-term view and diversification are warranted.
Some of the best performers in 2021 were carbon credit futures funds that gained 126.4%
While sustainable ETFs registered an average gain of 12.4% in 2021 followed by a drop of -7.15% in January of 2022, some of the best returns over both periods were registered by a small number of sustainable thematic-oriented funds that invest in carbon credit futures. The two funds in operation throughout 2021, one ETF and the other organized in the form of an Exchange Traded Note (ETN), posted gains of 108.8% and 144.0%, for an average increase of 126.4%. Two additional carbon credit futures funds were launched in October 2021 and for the month of January, the four funds posted an average gain 3.84%. Returns, however, ranged from -13.50% to 10.77%. The variation in returns was attributable to the performance of different carbon markets that played out more distinctly in late 2021 and into January 2022 due to the divergence in the results achieved in the European carbon markets versus the US. While there is a compelling case to be made for investing in carbon credits, especially for long-term sustainable investors able to tolerate near-term price fluctuations, the January results illustrate the benefits of diversification. When investing in carbon credit funds, geographic diversification across a basket of emissions-related mechanisms can cushion price volatility.
Carbon credits linked to emissions-related mechanisms operating as cap-and-trade regimes intended to reduce CO2
Carbon credits or allowances are financial instruments that represent a ton of CO2 and other greenhouse gas emissions removed or reduced from the atmosphere pursuant to an emissions-related mechanism, such as the EU Emission Trading System (EU ETS), the California Carbon Allowance (CCA), which is also tied to the Canadian province of Quebec’s cap-and-trade system through the Western Climate Initiative, and the Regional Greenhouse Gas Initiative (RGGI) that covers the US states from Virginia to Main. Considered the world’s major emissions related mechanisms operating on the cap-and-trade principle, they are not alone. There are other carbon pricing initiatives in operation or are being developed throughout the world, for example the UK, China and South Korea.
In a cap-and-trade regime, a limit or cap is typically set by a regulator, such as a government entity or supranational organization, on the total amount of specific greenhouse gases, such as CO2 that can be emitted by regulated entities, like manufacturers or energy producers. The regulator then issues or sells “emission allowances” to regulated entities that may then buy or sell the emission allowances on the open market. To the extent that the regulator may then reduce the cap on emission allowances, regulated entities are thereby incentivized to reduce their emissions; otherwise they must purchase emission allowances on the open market, where the price of such allowances will likely be increasing as a result of demand, and regulated entities that reduce their emissions will be able to sell unneeded emission allowances for profit. Commodity futures contracts linked to the value of emission allowances are known as “carbon credit futures.”
Role of emission-related mechanisms in combating climate change strengthened at COP26
As a tool for reducing greenhouse gas emissions cost-effectively, emission-related mechanisms can play an important role in combating climate change¹. This approach was strengthened at the 26th Conference of the Parties (COP26) recently held in Glasgow, Scotland, during which delegates from at least 193 countries agreed to several breakthrough pledges, including a commitment to reduce carbon emissions by 45% by 2030 along with various initiatives targeting emissions on methane, coal, deforestation and transport as well as progress on updating rules under Article 6 of the Paris Climate Agreement (COP 25) which reflect how voluntary carbon trading markets can be monitored to assure that reductions are real and are retired after use.
In addition to offering exposure to a market segment intended to facilitate a transition to a low carbon economy, carbon credits allow investors to take a view on carbon emissions futures prices that should increase in the long term as the number of outstanding certificates are withdrawn while demand expands as entities strive to meet CO2 reduction targets. That said, investments in carbon credits are not insulated from risks. These range from supply and demand disruptions that can lead to market and volatility risk, governmental policies, economic events, and technical issues of the type recently observed in California’s CCA, to mention just a few.
¹There is some debate about the effectiveness of a carbon tax versus carbon credits.
Four relatively new investment options currently available to investors
Of the four investment products currently available (refer to Table 1), three are structured in the form of index tracking ETFs launched by KraneShares and managed by Krane Funds Advisors and Climate Finance Partners. These funds, KraneShares Global Carbon Allowanace Strategy ETF (KRBN), KraneShares European Carbon Allowance Strategy ETF (KEUA) and KraneShares California Carbon Allowance Strategy ETF (KCCA), commenced operations in 2020 and 2021 and they offer exposures to the largest multiple as well as single markets. They have a limited track record and their expense ratios are significantly above average, but they are also the only ETFs operating in the space. The fourth product is also passively managed but organized in the form of an Exchange Traded Note that tracks the performance on an index created by Barclays Bank PLC that is primarily linked to the EU Emission Trading System futures contracts. The iPath Series B Carbon ETN (GRN), a successor to the iPath Global Carbon ETN (GRNTF), was launched as of September 10, 1999 and is listed for trading on the NYSE ARCA. Not to be confused with an ETF, an ETN is an unsecured debt obligation of the issuer, Barclays Bank PLC. Any payment to be made on the ETNs, including any payment at maturity or upon redemption, depends on the perceived creditworthiness of Barclays Bank PLC to satisfy its obligations as they come due. That said, Barclays Bank PLC long-term rating is A by S&P Global, a strong investment grade rating that signifies strong capacity to meet financial obligations. Further, ETNs are generally less liquid than ETFs.
Carbon credit prices rose sharply in 2021 but prices diverged in January 2022
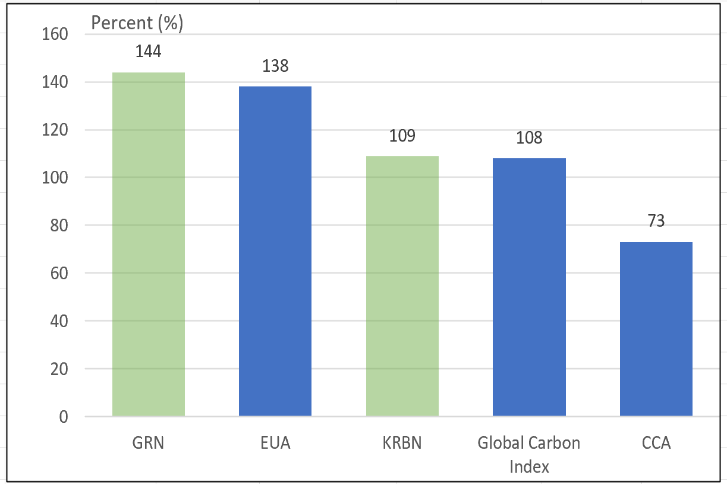
Carbon credit prices rose sharply in 2021. The IHS Markit Global Carbon Index, which combines European Union, California, the Regional Greenhouse Gas Initiative (RGGI) and most recently the UK Allowances (UKA) carbon credit futures, returned 108% in 2021. The European Union carbon allowance (EUA) futures returned 138% and the California Carbon Allowance (CCA) futures returned 73%. Each market or market segment benefited from favorable supply and demand factors and the advancement of various CO2 reduction initiatives at COP26 as previously noted. Against this backdrop, KRBN and GRN posted very strong gains of 108.83% and 144.01%, respectively. Refer to Charts 1 & 2.
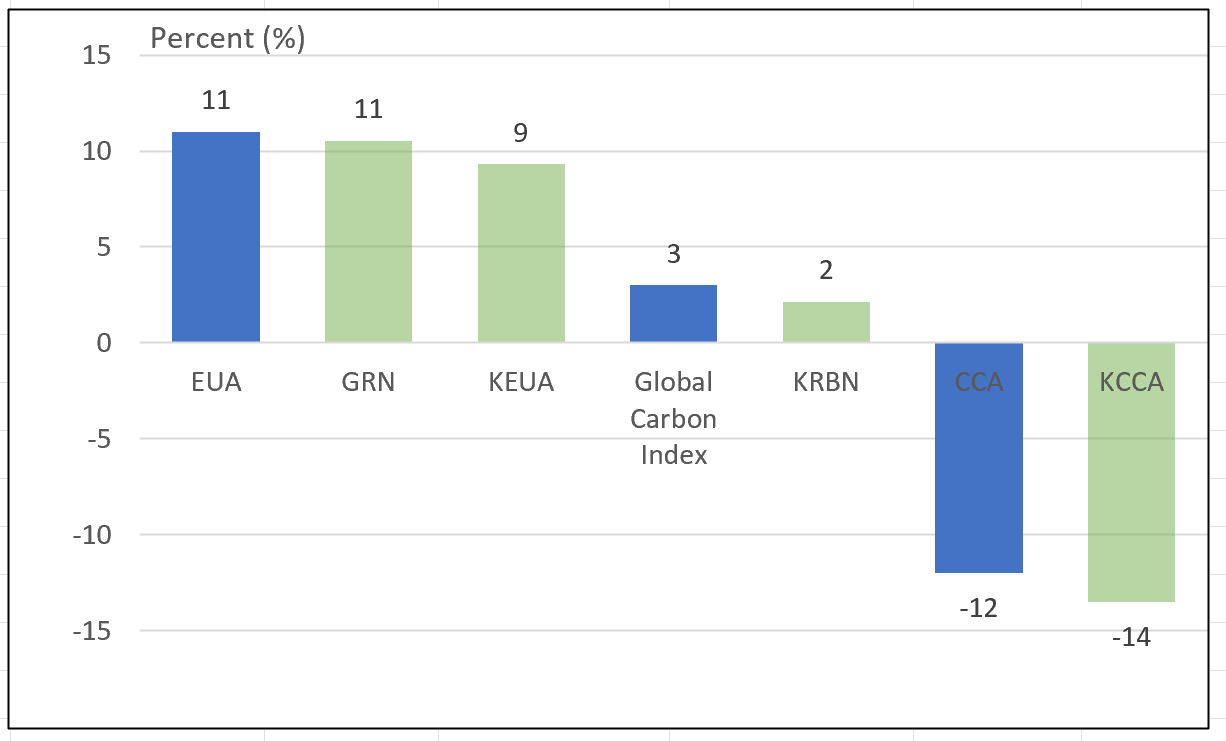
More recently in the month of January 2022, the IHS Markit Global Carbon Index was up 3%. At the same time, results in January diverged between European and California markets, with the former registering a gain of 11% and -12%, respectively. According to some sources, the California market experienced a buildup of speculative activity that corrected during the month of January. Still, the best approach for investors is to reduce exposure to potential volatility by investing in a more balanced portfolio like KRBN or by combining multiple portfolios to achieve the same result.
Chart 1: 2021 Performance Results
Chart 2: January 2022 Performance Results Notes of Explanation: Performance results=total returns. Data sources: HIS Markit, Morningstar Direct
Table 1: Carbon credit futures ETFs and ETN, AUM, expense ratios, performance and strategies
Fund Name | AUM ($) | Expense Ratio (%) | Jan. 2022 TR (%) | 2021 TR (%) | Investment Strategy |
KraneShares Global Carbon Strategy ETF* (KRBN) | 1,721.6 | 0.78 | 2.13 | 108.83 | The fund seeks to maintain exposure to carbon credit futures that are substantially the same as those included in the IHS Markit Global Carbon Index designed to measure the performance of a portfolio of liquid carbon credit futures that require “physical delivery” of emission allowances issued under cap-and-trade regimes. The index includes only carbon credit futures that mature in December of the next one to two years and that have a minimum average monthly trading volume over the previous six months of at least $10 million. Eligible carbon credit futures issued by cap-and-trade regimes in the following geographic regions. (1) Europe, the Middle East and Africa, (2) the Americas, and (3) the Asia-Pacific. In addition, no single carbon credit futures contract expiring in a particular year will receive an allocation of less than 5% or more than 60% at the semi-annual rebalancing or annual reconstitution of the Index. As of year-end 2021, the Index included carbon credit futures linked to the value of emissions allowances issued under the following cap and trade regimes: the European Union Emissions Trading System, the California Carbon Allowance, and the Regional Greenhouse Gas Initiative. The UK Allowances (UKA) carbon credit futures was added prior to year-end 2021. |
iPath Series B Carbon ETN (GRN) | 155.1 | 0.75% | 10.54 | 144.01 | The fund tracks the performance of the Barclays Global Carbon II TR USD Index, providing exposure to futures contracts on carbon emissions credits from two emissions-related mechanisms, but primarily the EU Emission Trading System (EU ETS). Prior to February 27, 2021, futures contracts on emission credits from the Kyoto Protocol’s Clean Development Mechanism were also eligible to be included in the Index, although the weight of those futures contracts within the index remained below 0.1%. |
KraneShares California Carbon Allowance Strategy ETF (KCCA)* | 113.6 | 0.79 | -13.50 | NAP | The fund seeks to maintain exposure to carbon credit futures that are substantially the same as those included in IHS Markit Carbon CCA Index designed to measure the performance of a portfolio of futures contracts on carbon credits issued under the California Carbon Allowance cap-and-trade regime, including carbon credits issued by Quebec since the California and Quebec markets were linked pursuant to the Western Climate Initiative in 2014. Carbon credits issued by Quebec consist of approximately 15% of the carbon credits issued under the California Carbon Allowance cap-and-trade regime. Qualifications of carbon credit futures same as KraneShares Global Carbon Strategy ETF. |
KraneShares European Carbon Allowance Strategy ETF* (KEUA) | 26.2 | 0.79 | 9.30 | NAP | The fund seeks to maintain exposure to carbon credit futures that are substantially the same as those included in IHS Markit Carbon EUA Index designed to measure the performance of a portfolio of futures contracts on carbon credits issued under the European Union Emissions Trading System cap-and-trade regime. Qualifications of carbon credit futures same as KraneShares Global Carbon Strategy ETF. |
Notes of Explanation: *Fund names change effective 12/3/2021 as well as investment objectives and strategies that now seek to achieve results in line with the index rather than exceed the performance of the index while at the same time preserving some strategy flexibility. Sources: Morningstar Direct and Sustainable Research and Analysis research based on fund prospectuses


