The Bottom Line: Green bond fund assets bounced back in July, adding $40.9 million in net assets as funds posted an average gain of 0.98%.
Summary
Gains in green bond fund assets bounced back to average 2021 levels, adding $40.9 million in net assets, or a month-over-month increase of 3% to end the month of July 2021 at $1,365.6 million. The year-to-date increase in net assets realized by the seven funds operating in this segment, including five mutual funds and two ETFs, for a total of 22 funds/share classes, stood at $281.8 million. Against a backdrop of declining US 10-year Treasury yields, the Bloomberg Barclays US Aggregate Bond Index added 1.12% while green bond funds posted an average gain of 0.98% or a 14 basis points (bps) negative differential. Over the trailing twelve months, however, green bonds recorded an average gain of 2.07% and trounce the conventional Bloomberg Barclays US Aggregate Bond Index by 214 basis points. Advances in fund net assets in July were not matched by green bonds issuance. $22.5 billion in green bonds came to market in July, bringing revised year-to-date totals to $251.5 billion or 211% higher relative to the same time interval last year. But month-over-month volume declined by 58%.
Green bond funds net assets added $40.9 million to end July at almost $1.4 billion
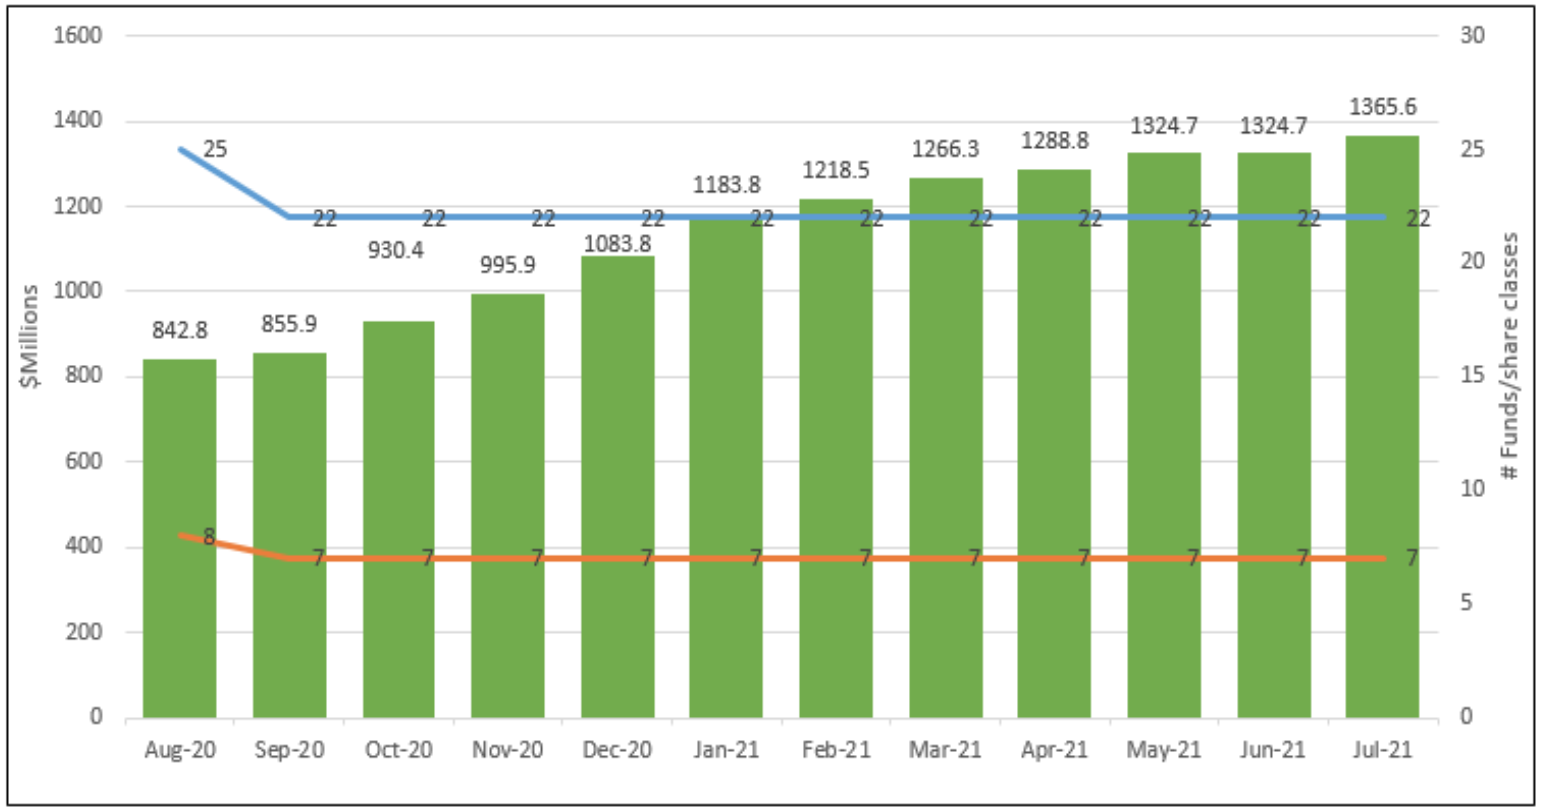
- The seven green bond funds that make up the thematic segment gained $40.9 million in assets to close the month of July at $1,365.6 million, or an increase of 3%. The July uptick stood in contrast to the previous month’s zero increase in net assets. Refer to Chart 1.
- Year-to-date gains in assets by the seven funds operating in this segment, including five mutual funds and two ETFs, for a total of 22 funds/share classes, stood at $281.8 million.
- About 93% of the July gain was attributable to just two funds. The Calvert Green Bond Fund alone added $31.6 million, including $27.4 million attracted to its institutional class I shares. The second fund, the iShares Global Green Bond Fund (BGRN), added $6.5 million to close the month at $219.7 million. BGRN is now the 6th largest fixed income ETF, accounting for 4.3% of fixed income ETF assets as of July 31st.
Chart 1: Green bond funds and assets under management-August 2020 – July 31, 2021

Notes of Explanation: Fund total net assets data source: Morningstar Direct; fund filings. Research and analysis by Sustainable
Research and Analysis LLC
July performance results
- Green bond funds posted an average gain of 0.98% in July, behind the 1.12% total return recorded by the Bloomberg Barclays US Aggregate Bond Index and 1.73% delivered by the ICE BofAML Green Bond Index Hedged US. Excluding the Franklin Municipal Green Bond Fund, a fund that invests in municipal green bonds that posted lower returns in July, the average performance of the six remaining investment companies was a slightly higher 1.01%. Refer to Table 1.
- The $219.7 million iShares Global Green Bond ETF was the best performer in July, posting a 1.74% gain and exceeding by 62 bps the next best performing Calvert Green Bond Fund I with its 1.12% return. Not in operation long enough to report a 3-year return history, iShares Global Green Bond ETF is up 1.12% over the trailing twelve months. It ranks second from the bottom across all 22 funds/share classes over the previous 12-month interval but managed to outperform the only other green bond ETF, the VanEck Vectors Green Bond Fund. Unlike BGRN, however, the fund restricts its green bond investments to US denominated instruments. Still, offered at an attractive expense ratio of 20 bps, reinforced by the fund’s management, size and global mandate, BGRN remains a strong candidate for consideration in a sustainable portfolio.
- While green bond funds were challenged in July to outperform, their track record over the trailing 12-months is much stronger. Green bond funds recorded an average gain of 2.07%, boosted by the performance achieved by the Franklin Municipal Green Bond Fund. Regardless, green bond funds beat both the Bloomberg Barclays US Aggregate Bond Index ICE BofAML Green Bond Index Hedged US.
- The three green bond funds that have been in operation for a full three-year period recorded an average gain of 5.27%. Funds with a non-US denominated only mandate outperformed the Bloomberg Barclays US Aggregate Bond Index but not the ICE BofAML Green Bond Index Hedged US.
Green bonds volume drops in July but year-to-date issuance is strong
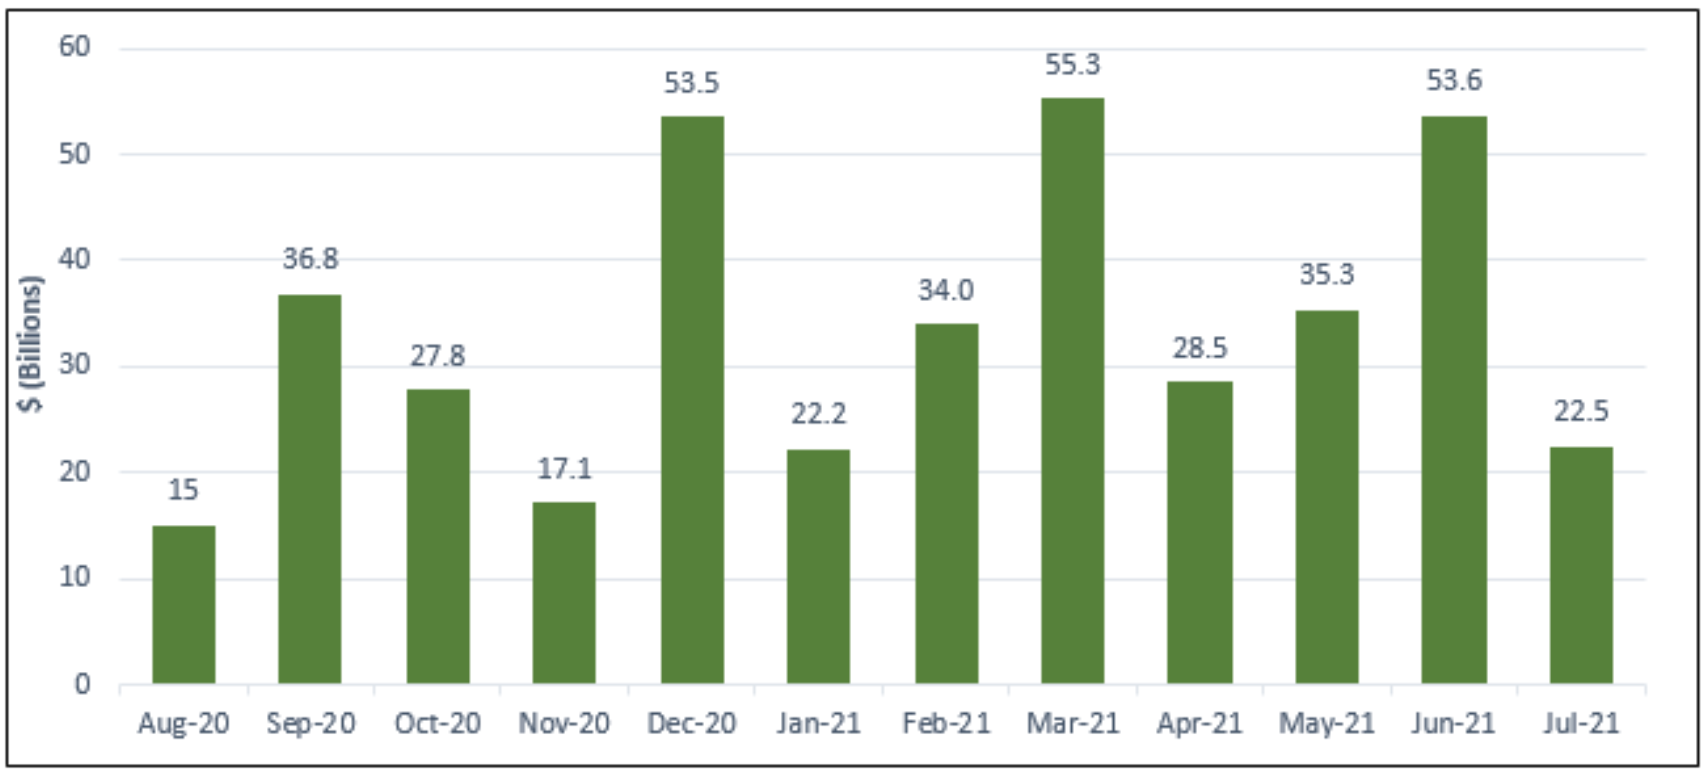
- $22.5 billion in green bonds were issued in July, bringing revised year-to-date totals to $251.5 billion or 211% higher relative to the same time interval last year. At the same time, month-over-month volume declined by 58%. Refer to Chart 2.
- Based on the year-to-date trajectory alone, green bonds volume should exceed last year’s $269.5 million issuance by a significant margin. That said, green bonds will likely get a strong boost from the just released United Nations Intergovernmental Panel on Climate Change report. According to the report which sounds the alarm about the possibility of irreversible changes to the climate, the earth’s surface warming is projected to reach 1.5C or 1.6C in the next two decades, based on updated data, due to human influence that is driving extreme weather events and leaves an increasingly narrow pathway to stabilizing temperatures at 1.5C above pre-industrial levels by the end of the century according the most ambitious goal of the Paris Climate Agreement. Still, the level of capital needed to address the transition to stabilizing temperatures are not likely to be secured through the issuance of green bonds alone.
Chart 2: Green bonds issuance worldwide-August 2020 – July 31, 2021

Source: Climate Bond Initiative (CBI)
Table 1: Green bond funds: Assets and performance results through July 31, 2021
| Fund Name | AUM ($M) | 1-Month Return (%) | 3-Month Return (%) | 12-Month Return (%) | 3-Year Average Return (%) | 5-Year Average Return (%) |
| Calvert Green Bond A | 89 | 1.1 | 1.76 | 1.16 | 5.39 | 3.15 |
| Calvert Green Bond I | 824.3 | 1.12 | 1.82 | 1.36 | 5.65 | 3.46 |
| Calvert Green Bond R6 | 9 | 1.12 | 1.83 | 1.41 | ||
| Franklin Municipal Green Bond A | 1 | 0.83 | 1.61 | 2.45 | ||
| Franklin Municipal Green Bond Adv | 7.6 | 0.85 | 1.63 | 2.56 | ||
| Franklin Municipal Green Bond C | 0.3 | 0.81 | 1.59 | 2.42 | ||
| Franklin Municipal Green Bond R6 | 0 | 0.87 | 1.66 | 2.51 | ||
| iShares Global Green Bond ETF | 219.7 | 1.74 | 2.3 | 1.12 | ||
| Mirova Global Green Bond A | 6.9 | 0.95 | 1.2 | 1.63 | 5.39 | |
| Mirova Global Green Bond N | 8.8 | 1.05 | 1.36 | 2 | 5.7 | |
| Mirova Global Green Bond Y | 27.8 | 0.95 | 1.25 | 1.86 | 5.66 | |
| PIMCO Climate Bond A | 0.7 | 0.88 | 1.63 | 2.96 | ||
| PIMCO Climate Bond C | 0.1 | 0.81 | 1.44 | 2.17 | ||
| PIMCO Climate Bond I-2 | 2 | 0.9 | 1.71 | 3.27 | ||
| PIMCO Climate Bond I-3 | 0.1 | 0.9 | 1.7 | 3.21 | ||
| PIMCO Climate Bond Institutional | 17.1 | 0.91 | 1.73 | 3.36 | ||
| TIAA-CREF Green Bond Advisor | 2.2 | 1.02 | 2.26 | 1.95 | ||
| TIAA-CREF Green Bond Institutional | 29.5 | 1.02 | 2.27 | 1.96 | ||
| TIAA-CREF Green Bond Premier | 1.1 | 1.01 | 2.23 | 1.86 | ||
| TIAA-CREF Green Bond Retail | 6.9 | 0.9 | 2.2 | 1.68 | ||
| TIAA-CREF Green Bond Retirement | 15.1 | 1.01 | 2.23 | 1.86 | ||
| VanEck Vectors Green Bond ETF | 96.4 | 0.81 | 1.88 | 0.71 | 3.84 | |
| Total/Averages | 1,365.6 | 21.56 | 39.29 | 45.47 | 31.63 | 6.61 |
| Bloomberg Barclays US Aggregate Bond | 0.98 | 1.79 | 2.07 | 5.27 | 3.31 | |
| Bloomberg Barclays Municipal Bond Index | 1.12 | 2.16 | -0.7 | 5.73 | 3.13 | |
| ICE BofAML Green Bond Index Hedged US | 1.73 | 2.38 | 1.6 | 5.87 | 3.93 | |
Notes of Explanation: Blank cells=NA. Fund total net assets and performance data source: Morningstar Direct; fund filings.
Research and analysis by Sustainable Research and Analysis LLC


