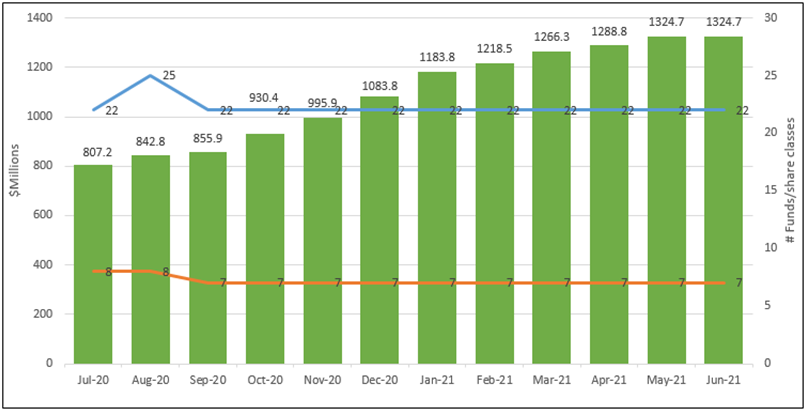
The Bottom Line: Net assets of green bond funds were flat in June, but registered an average gain of 50 bps, falling behind market indices.
Summary
Green bond funds were flat in terms of assets under management on a net basis in June, just falling short of offsetting an average 50 bps increase in total return performance. Green bond funds ended the month as they had begun, with a combined total of $1,324.7 billion in net assets. This compared to a gain of $35.9 million in May and a year-to-date increase of $240.9 million. With its 50 increase in August, the seven green bonds funds came in behind the performance of the investment-grade intermediate Bloomberg Barclays US Aggregate Bond Index and the ICE BofAML Green Bond Index Hedged US by 11 and 20 bps, respectively. Unlike green bond funds that remained flat in June, green bonds issuance volume gained traction, posting $40.82 billion in new bonds and closing the first six months of the year at 75% of last year’s entire green bond issuance.
Net Assets Commentary
- Green bond funds, unchanged at seven funds in total comprised of 22 funds and share classes, ended June at $1,324.7 and remained flat relative to May on a net asset value basis. The segment experienced modest cash outflows, estimated at $6.9 million. This was the lowest month-over-month change in net assets since the segment gave up $39.9 million in March 2020.
- The Calvert Green Bond Fund gave up a net of $11.7 million, attributable to net withdrawals by institutional investors in the amount of $13.6.
- VanEck Vectors Green Bond ETF gained a net of $7.3 million, bringing the fund’s total to $95.8 million; iShares Global Green Bond ETF added a net of $1.2 million.

Performance Commentary
- Green bond funds posted an average gain of 50 bps in June, lagging behind an increase of 61 bps registered by the ICE BofAML Green Bond Index Hedged US, 70 bps recorded by the Bloomberg Barclays US Aggregate Bond Index.
- That said, the average results achieved by the green bond funds over the trailing twelve months eclipsed both conventional benchmarks while the three year average performance results, applicable to just three funds, including the oldest and largest Calvert Green Bond Fund, are mixed.
- In June, performance results ranged from a low of 0.30% scored by the Franklin Municipal Green Bond Fund and each of its three share classes to a high of 0.73% delivered by the TIAA-CREF Green Bond Fund Advisor and Institutional shares. The fund, which has been in operation since November 2018 and has now reached $53.8 million in net assets, offers a satisfying combination of performance results, albeit over a still shorter time interval, green bond management credentials and disclosure of outcomes. At the same time, the expense ratio for retail investors is above the 65 bps median for the seven funds segment.
- The only fund to invest entirely in green municipal securities, the Franklin Municipal Green Bond Fund bested the Bloomberg Barclays Municipal Bond Index that was up 27 bps in June.
Green bonds volume
- After reaching three-month peak in March of this year during which $49.6 billion in green bonds were issued, volumes ticked lower in April.
- Since then, issuance gained traction, rising to $31.9 billion in May and $40.8 billion in June.
- In the second quarter, volume reached $96.7 billion, slightly lower that the first quarter’s $104.9 billion. But cumulatively in the first six months, green bonds reached $201.6 million, or 75% of last year’s entire green bond issuance.
- In part, higher volumes are due to stepped up issuances in China. According to China Daily, in the first five months of this year, 150 green bonds worth 192.5 billion yuan ($29.8 billion) were issued in China’s bond market, up by 56.25% and 82.72% year-over-year.

| Fund Name | TNA ($) | Expense Ratio (%) | 1-Month Return | 12-Month Return | 3-Year Average | 5-Year Average |
| Calvert Green Bond A | 85 | 0.73 | 0.47 | 2.12 | 5 | 3.1 |
| Calvert Green Bond I | 796.9 | 0.48 | 0.49 | 2.38 | 5.28 | 3.43 |
| Calvert Green Bond R6 | 8.8 | 0.43 | 0.5 | 2.43 | ||
| Franklin Municipal Green Bond A | 1 | 0.71 | 0.38 | |||
| Franklin Municipal Green Bond Adv | 6.6 | 0.46 | 0.38 | 3.71 | ||
| Franklin Municipal Green Bond C | 0.3 | 1.11 | 0.38 | |||
| Franklin Municipal Green Bond R6 | 0 | 0.46 | 0.3 | |||
| iShares Global Green Bond ETF | 213.2 | 0.2 | 0.57 | 0.86 | ||
| Mirova Global Green Bond A | 6.7 | 0.98 | 0.53 | 2.67 | 5.05 | |
| Mirova Global Green Bond N | 9.7 | 0.68 | 0.5 | 3.04 | 5.37 | |
| Mirova Global Green Bond Y | 26.2 | 0.73 | 0.49 | 3 | 5.32 | |
| PIMCO Climate Bond A | 0.7 | 0.9 | 0.38 | 3.43 | ||
| PIMCO Climate Bond C | 0.1 | 1.65 | 0.32 | 2.66 | ||
| PIMCO Climate Bond I-2 | 1.9 | 0.6 | 0.41 | 3.74 | ||
| PIMCO Climate Bond I-3 | 0.1 | 0.65 | 0.4 | 3.69 | ||
| PIMCO Climate Bond Institutional | 17.9 | 0.5 | 0.41 | 3.84 | ||
| TIAA-CREF Green Bond Advisor | 1.8 | 0.55 | 0.73 | 3.01 | ||
| TIAA-CREF Green Bond Institutional | 29.1 | 0.45 | 0.73 | 3.02 | ||
| TIAA-CREF Green Bond Premier | 1.1 | 0.6 | 0.72 | 2.92 | ||
| TIAA-CREF Green Bond Retail | 6.9 | 0.8 | 0.71 | 2.83 | ||
| TIAA-CREF Green Bond Retirement | 14.9 | 0.7 | 0.63 | 2.92 | ||
| VanEck Vectors Green Bond ETF | 95.8 | 0.2 | 0.65 | 1.71 | 3.64 | |
| Total/Averages | 1324.7 | 0.66 | 0.50 | 2.84 | 4.94 | |
| ICE BofAML Green Bond Index Hedged US | 0.61 | 1.38 | 5.32 | 3.77 | ||
| Bloomberg Barclays US Aggregate Bond Index | 0.7 | -0.33 | 3.34 | 3.03 | ||
| Bloomberg Barclays Municipal Bond Index | 0.21 | 4.17 | 5.11 | 3.25 |


