Model portfolios: Each of the three portfolios beat their conventional benchmarks in March with returns of 1.69%, 1.78% and 1.88%
The three model portfolios beat their comparative benchmarks in March, benefiting from the performance of Domini Impact International Equity-Investor and TIAA-CREF Social Choice Bond-Retail which exceeded the performance results achieved by their corresponding conventional indexes by 30 basis point (bps) and 2 bps, respectively. The last time all three portfolios outperformed their benchmarks was in October of 2018.
The Aggressive Sustainable Portfolio (95% stocks/5% bonds), Moderate Sustainable Portfolio (60% stocks/40% bonds) and Conservative Sustainable Portfolio (20% stocks/80% bonds) posted total returns of 1.69%, 1.78% and 1.88%, respectively. Refer to Table 1.
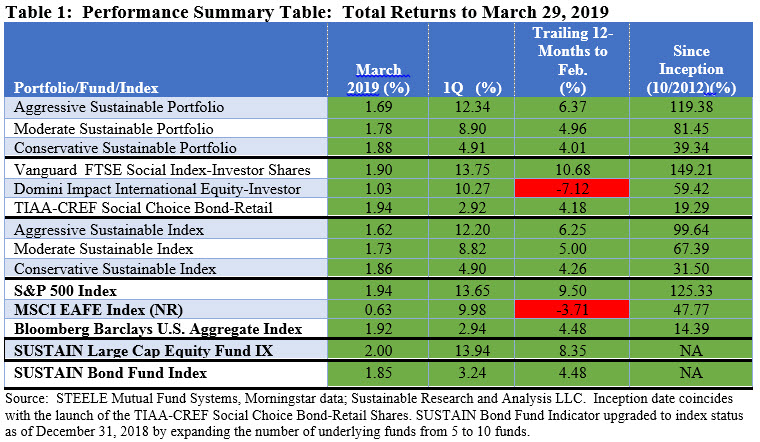
The excess benchmark performance results achieved by the three portfolios extended to the first quarter, with the three portfolios recording gains of 12.34%, 8.90% and 4.91% and surpassing the performance of their benchmarks by 14 bps, 8 bps and 1 bp, respectively.
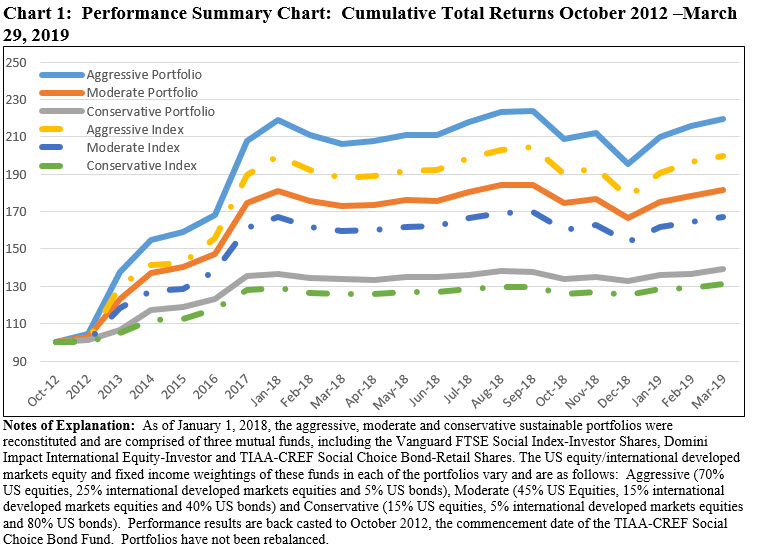
Advancing as they did in March, the three model portfolios expanded for the third consecutive month their lead relative to their underlying benchmarks for the interval since inception as of October 2012, which now stands at 19.7%, 14.1% and 7.8%. Refer to Chart 1.
U.S. stocks, as measured by the S&P 500 Index, ended March up 1.94% while investment-grade intermediate bonds, based on the Bloomberg Barclays US Aggregate Index end the month up 1.92% or just 4 basis points shy of equities; excepting of Latin America, markets outside the US ended the month in the black but did not perform as well as the US market
The results achieved by each of the three model portfolios were powered by the performance of U.S. and foreign stocks as well as bonds. As measured by the S&P 500 Index, the broad market in the US ended the month of March up 1.94%. The Nasdaq Composite posted an even better 2.17% while the Dow Jones Industrial Average eked out a small 0.17% gain. At the same time, large cap sustainable equity funds, as measured by the Sustainable Large Cap Equity Fund Index, posted an increase of 2.0%, eclipsing the S&P 500 by 0.06%. The US markets responded to a shift in the posture of the Federal Reserve Bank and other central banks to hold interest rates as well as to growing confidence that the US and China would reach an agreement on trade. This, given a backdrop of slowing consumer spending and income growth reflected in the downward revisions to gross-domestic product growth to 2.2% for the fourth quarter of 2018 and 2.9% for the full year. While still a bright spot globally, US economic concerns were reflected in the behavior of bond yields. The 10-year Treasury note, which started the month at 2.73% and dropped by 32 basis points to end at 2.41%, inverted relative to the 3-month-Treasury bills that closed March at 2.40%. This, combined with the strong 3.32% return achieved by AAA corporate bonds lifted the Bloomberg Barclays US Aggregate Bond Index (BB Index). The index ended the month with a gain of 1.92%, the best monthly result since January 2015 and just 4 basis points (bps) shy of the S&P 500. The BB Index surpassed the 1.85% increase registered by the Sustainable Bond Fund Index.
After logging strong results of 5.20% in February and 11.25% in January of this year, the momentum of small cap stocks was halted. Based on the performance of the Russell 2000 index, small cap stocks gave up -2.09% while growth stocks outperformed value stocks.
With the exception of Latin America, markets outside the US ended the month in the black but did not perform as well as the US market. The MSCI ACWI NR index posted a gain of 1.26% while MSCI EAFE ended higher, recording an increase of 0.63%. MSCI China gained 2.44% while Latin America was down 2.53%.
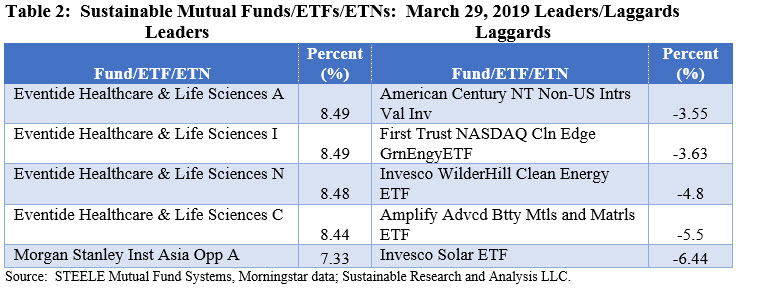
Best performing sustainable fund up 8.49% in March while the worst performing fund gave up -6.44%
The universe of 1,915 mutual funds and their share classes, ETFs and ETNs posted an average total return of 0.99% in March. When dimensioned along fixed income funds versus all other funds, the outcome was unusual in that the average 1.0% performance of fixed income funds, including taxable and municipal funds, eclipsed the total 0.98% total return results achieved by equity funds as well as other related funds.
The best performing fund in March was the Eventide Healthcare and Life Sciences Fund A, up 8.49%. This is a diversified mutual fund representing the adviser’s “best ideas” for long-term capital appreciation in the healthcare and life sciences sectors (greater than or equal to 80%). The fund concentrates its investments in the drug-related industries (greater than or equal to 25%) and employs a values-based negative screening sustainable investing approach. The adviser, Eventide Asset Management, LLC, analyzes each potential investment’s ability to operate with integrity and create value for customers, employees, and other stakeholders. While few companies may reach these ideals in every area of their business, these principles articulate the adviser’s ideal characteristics of good corporate behavior. (Refer to the Sustainable Investment Glossary for further details).
Invesco Solar ETF, an index fund managed by Invesco Capital Management LLC, was the worst performing fund in March, giving up 6.44%. This solar industry thematic fund invests in companies that derive a significant amount of their revenues from solar power equipment producers including ancillary or enabling products such as tracking systems, inverters, or batteries; suppliers of raw materials, components or services to solar producers or developers; companies that produce solar equipment fabrication systems; companies involved in solar power system installation, development, integration, maintenance, or finance; or companies that sell electricity derived from solar power. Refer to Table 2.
Sustainable funds pierce through half trillion for the first time and reach new high of $627 billion, benefiting from a large number of fund re-brandings and capital appreciation in March
For the sixth consecutive month, sustainable funds, including mutual funds, ETFs and ETNs, registered another monthly all-time high of $627.5 billion in assets under management as of March 29, 2019. Funds added a net of $137.2 billion in assets for the month versus net additions of $45.3 billion and $49.8 billion, respectively, in January and February of the first quarter. Refer to Chart 2. Of this sum, $131.4 billion is due to re-branded or repurposed funds, an estimated $4.9 billion is attributable to market movement while an estimated $0.9 billion is due to net new cash flows.
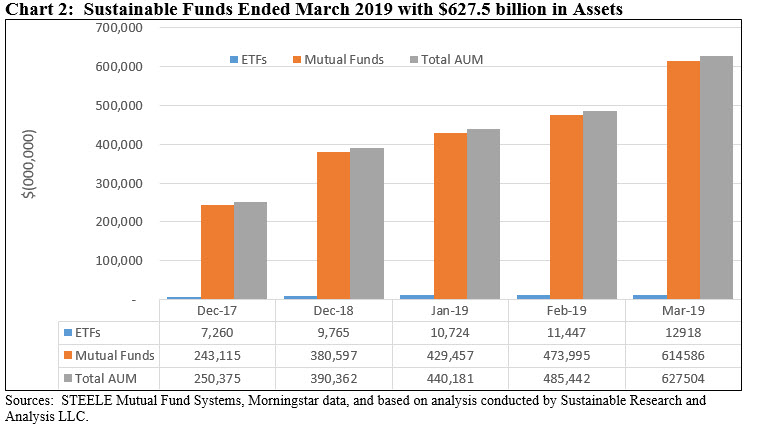
1Q Observation: sustainable assets expanded from $390.4 billion, adding $237.1 during the first quarter, or an increase of 61%.
Since the start of the year, sustainable assets expanded from $390.4 billion, adding $237.1 during the first quarter, or an increase of 61%. As is the case in March, the net increase is largely attributable to fund re-brandings which added a whopping $183.2 billion in net new assets, or 79% of the total increase while market movement and net cash flows added an estimated $47.4 billion and $1.6 billion, respectively.
In the aggregate, mutual funds/share classes, ETFs and ETNs jumped from 1,163 funds to 1,923 funds at the end of March, or an increase of 65.3% due to the large number of fund re-brandings. Mutual funds and their corresponding assets under management jumped dramatically, adding $234 billion, or a 61% increase, to end the quarter with $614.6 billion. This also served to lift the proportion of mutual funds to ETFs from 97.6% at the end of February to 97.9% at the end of March. The assets were distributed across 1,833 mutual funds/share classes and 90 ETFs/ETNs offered by 131 separate firms. That said, just 45 mutual funds and share classes accounted for 50.3% of total sustainable mutual fund assets. For more detailed information, refer to article entitled Monthly Sustainable Mutual Funds Cash Flows: March 2019.