The Bottom Line: The largest actively managed sustainable equity funds are outperforming their designated securities market indices in 50% or more of three time periods.
0:00
/
0:00
Listen to this article now

Observations:
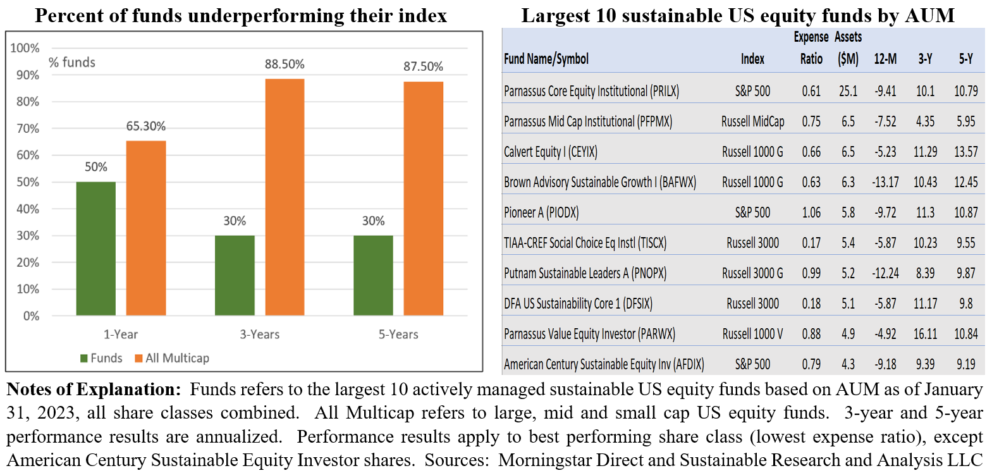
- By one measure, the largest actively managed sustainable US equity funds are outperforming their designated and appropriate benchmarks at levels that exceed conventional funds, with 50% or more outperformance over 1-year, 3-year and 5-year time intervals. This contrasts with the often-cited research that most active managers across a broad mix of fund categories over short and long-term time intervals fail to outperform their comparison securities market index with underperformance rates increasing over longer time periods.
- The largest ten actively managed sustainable US equity funds by assets as of January 31, 2023 represent a segment that includes mutual funds employing varying sustainable investing approaches that range from ESG integration, some with minimum thresholds and exclusions, to a responsible investing approach the seeks out companies and other issuers that provide positive leadership in the areas of their business operations and overall activities that are material to improving long-term shareholder value and societal outcomes, including active engagement with companies. The ten funds compare their performance results to securities market indices that include the S&P 500, Russell 3000, Russell 3000 Growth Index, Russell 1000 Growth Index, Russell 1000 Value Index and Russell Mid Cap Index. After fees performance results were evaluated relative to their designated index over the trailing 1-year, 3-year and 5-year time intervals to January 31st, based on the results achieved by the best performing share class. For funds with multiple share classes, this typically represents the share class offered at the lowest expense ratio. The analysis is limited to the three time periods capped by five years to avoid the need for substitutions due to limited track records in some cases.
- On this basis, over the three-time intervals, the ten funds registered levels of underperformance relative to their benchmarks of 50%, 30% and 30% respectively. These levels are considerably lower than the levels of underperformance recorded by actively managed funds tracked by S&P Indices Versus Active (SPIVA) scorecard reports that measure actively managed funds against their appropriate benchmarks on a semiannual basis. Based on the latest data through June 30, 2022 that combines all multi-cap equity funds and compares their performance against the S&P 1500 Index, levels of underperformance are 65.3% for 1-year, 88.4% for 3-years, and 87.53% for 5-years.
- The outperformance after expenses of sustainable actively managed US equity funds relative to their comparison benchmark, positive or negative, range from a high of 10.8% registered by the Calvert Equity Fund I (CEYIX) in the trailing 12-months to January 2023 to a low of 22 basis points recorded by Parnassus Core Equity Fund Institutional shares (PRILX) on an average annual basis over the trailing three years.
- Expense ratios applicable to the ten funds average 67 basis points and range from a low of 17 basis points applicable to TIAA-CREF Social Choice Equity Fund Institutional shares (TISCX) to a high of 1.06% levied by Pioneer Fund A (PIODX).


