Summary
The imposition of recently announced tariffs on imported solar cells and modules are likely to drive the prices of solar panels higher and potentially reshuffle the renewable-energy industry. But this is not expected to adversely impact the renewable energy sector as it is projected to expand the fastest, relative to other fuel sources, between today and 2040 and continuing to mid-century. Investors generally and sustainable oriented investors, in particular, seeking to gain exposure to the renewable energy sector can do so by allocating a segment of their portfolio to this theme. Although their characteristics vary, investors can choose from at least 14 actively and passively managed mutual funds, exchange-traded funds (ETFs) and exchange-traded notes (ETNs).
U.S. Imposed Safeguard Tariffs on Imported Large Residential Washing Machines and Imported Solar Cells and Modules
Last week the Office of the U.S. Trade Representative announced that President Trump has approved recommendations to impose safeguard tariffs on imported large residential washing machines and imported solar cells and modules. Published on January 22, 2018, the agreed upon tariffs fell in the middle of the range of recommended options available to the President and were in response to findings by the independent bipartisan U.S. International Trade Commission (ITC) that increased foreign imports of washers and solar cells and modules are a substantial cause of serious injury to domestic manufacturers. The tariffs affect the building blocks of the solar panels that cover rooftops and utility fields across the U.S. and are likely to drive the panel’s prices higher and potentially reshuffle the renewable-energy industry.
For imports of solar cells and modules, the relief that was approved will include a tariff of 30 percent in the first year, 25 percent in the second year, 20 percent in the third year, and 15 percent in the fourth year. Additionally, the first 2.5 gigawatts of imported solar cells will be exempt from the safeguard tariff in each of those four years. The action is expected to impact solar stocks to varying degrees as the tariff will drive up prices in one of the solar market’s promising segments, however, in the long run solar power is expected to continue to get cheaper and replace fossil-fuel generated electricity.
Renewable energy is projected to expand the fastest as a fuel source between today and 2040 and continuing to mid-century at 2050
While projections can vary substantially, renewable energy is projected to expand the fastest between today and 2040, increasing from almost 4% of share to an estimated 8.04% and an even higher 9.73% share by mid-century in 2050[1]. According to the U.S. Information Administration’s Annual Energy Outlook 2017 overall energy consumption projections remains relatively flat through 2040, rising 5% from the 2016 level and somewhat close to its previous peak. That said, the fuel mix changes significantly. Lower prices combined with global initiatives to combat the threat of climate change by reducing carbon dioxide emissions in line with the Paris Climate Agreement’s aim to keep a global temperature rise this century well below 2°C above pre-industrial levels and to pursue efforts to limit the temperature increase even further to 1.5°C, are contributing to the increased demand for natural gas. This is led by demand from the industrial and electric power sectors which is expected to rise more than other fuel sources in terms of quantity of energy consumed.
Petroleum consumption remains relatively flat as increases in energy efficiency offset growth in the transportation and industrial activity measures. At the same time, coal consumption decreases as coal loses market share to natural gas and renewable generation in the electric power sector while renewable energy, on a percentage basis, grows the fastest. This is attributable to the continued decline in capital costs with increased penetration and expectation for the continued strong support long-term for the use of renewable energy internationally and in the U.S. at the federal, state and local levels, notwithstanding reversals at the federal level in the short-to-intermediate-term. Refer to Chart 1.
Chart 1: Energy Consumption: 1980- 2040
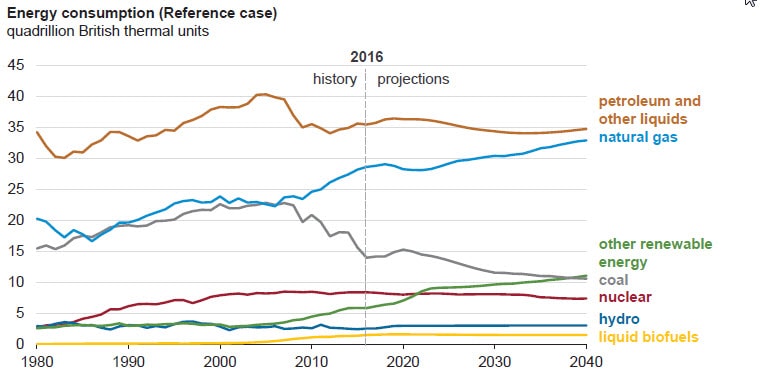
Source: U.S. Information Administration Annual Energy Outlook 2017
14 actively and passively managed mutual funds, exchange-traded funds (ETFs) and exchange-traded notes (ETNs)
In addition to individual stocks and bonds, including green bonds or plain vanilla bonds that raise capital specifically to be allocated to finance environmentally beneficial projects, investors generally and sustainable oriented investors in particular seeking to gain exposure to the renewable energy sector by allocating a segment of their portfolio to this theme can choose from at least 14 actively and passively managed mutual funds, ETFs and ETNs. These range from two ETFs that focus exclusively on companies participating in the wind or solar energy industries to three mutual funds, for a total of 5 including share classes, and 10 ETFs that invest more broadly in alternative energy and alternative energy technology companies globally or listed for trading in the US. One ETN provides exposure to the global price of carbon. Refer to Table 1 for a complete listing of these fund along with brief descriptions. For expanded descriptions, refer to the Investment Research/Basics/Sustainable Investment Strategies tab.
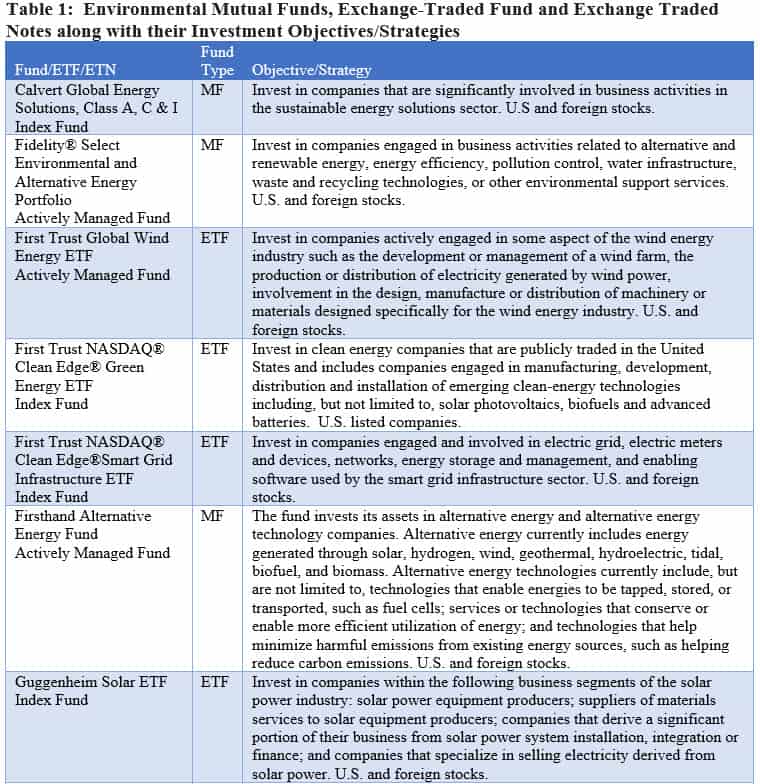
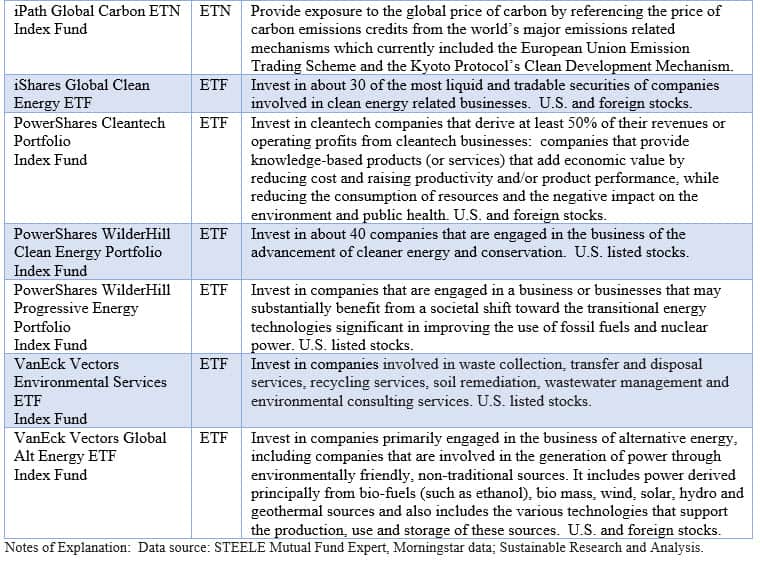
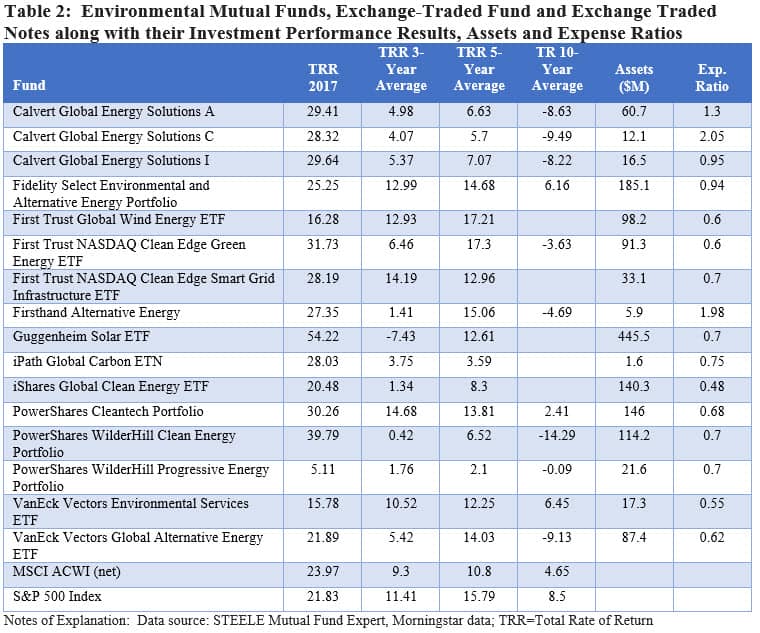
In addition to geographic exposures, each of these funds pursues varying strategies and emphasizes different aspects of the renewable energy market segment, in some cases reflecting only slight variations. In general, the funds performed well in 2017, but their performance track record over the last 3, 5 and 10-years, to the extent they were in operation, is mixed. Five of the 12 ETFs/ETNs remain small in size, with less than $50 million in assets, while expense ratios in general fall outside the lowest end of the range for both specialty ETFs as well as mutual funds. Refer to Table 2.
As is the case with all investments, investors should understand the variations mentioned above before making an investment decision. In addition, investors should consider the skills of the investment adviser, track record and risk profile, fund expenses, size and tenure of the fund.
[1] Source: U.S. Information Administration Annual Energy Outlook (AEO) 2017, based on the Reference case projection which assumes trend improvement in known technologies, along with a view of economic and demographic trends reflecting the current central views of leading economic forecasters and demographers. It generally assumes that current laws and regulations affecting the energy sector, including sunset dates for laws that have them, are unchanged throughout the projection period. The potential impacts of proposed legislation, regulations, or standards are not reflected in the Reference case. Projections in the AEO should be interpreted with a clear understanding of the assumptions that inform them and the limitations inherent in any modeling effort.


