The Bottom Line: With some volatility during the month, the S&P 500 gained 2.76% in February while active sustainable fund managers beat comparative conventional indices.
With some volatility during the month, S&P gains 2.76% in February while active sustainable fund managers beat comparative conventional indices
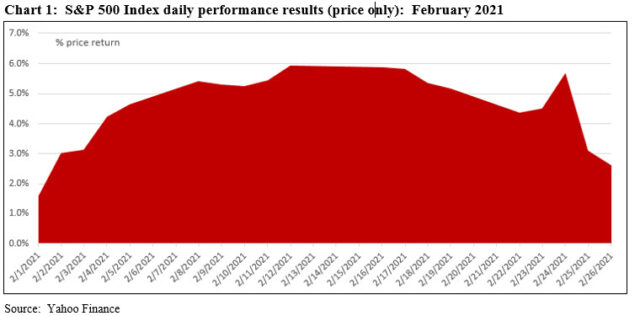
Government spending, aggressive monetary policy, low interest rates, coronavirus optimism and rising corporate earnings were some of the reasons US stocks gained upward momentum during the first ten trading days of the month, adding some 5.9% until February 16th. But rising bond yields and inflation concerns overcame improving economic data to produce a follow-on -3.1% decline. This occurred during the succeeding nine trading days of the month that ended with the passage by the House of the Biden administration’s $1.9 trillion coronavirus relief package, including a $1,400 direct payment to many Americans, and sending it on to the Senate. In the end, after ticking up briefly before February 26th, the S&P ended the month up 2.76% on a total return basis (2.6% price only). Refer to Chart 1. The Dow Jones Industrial ended higher, posting a 3.4% gain while the NASDAQ Composite added 1%. Value eclipsed growth, with small cap value stocks recording a gain of 10.8%, according to the S&P 600 Value Index while small cap stocks in general outperformed large cap and mid cap stocks. The energy sector across the range of market caps delivered strong results, ranging from 18.8% to 24.1% achieved by small cap energy stocks, followed by financials, up between 11% and 12%.
The anticipation of strong economic growth on the back of stepped up vaccination efforts along with unprecedented fiscal and monetary stimulus fueled concerns about higher inflation that, in turn, led to rising yields. The 10-year Treasury gained 33 bps to end February at 1.44%–a level not observed since February of 2020. Against this backdrop, the Bloomberg Barclays US Aggregate Bond Index gave up -1.44%–the worst monthly decline since November 2016. Higher quality bonds in general ended up in the red, with steeper declines affecting longer dated securities. On the other hand, lower rated bonds posted narrow gains.
Fears of faster-than-anticipated interest rate increases are likely to produce episodes of heightened financial market volatility over the course of 2021 as the recovery from last year’s recession gains steam.
For the most part, global and international equity markets posted positive results in February. The MSCI ACWI ex USA Index gained 1.98% while the MSCI EAFE Index and MSCI Emerging Markets Index were up 1.19% and 0.76%, respectively. France and Germany gained 5.0% and 2.1% while Brazil and China gave up -6.3% and -1.0% in that order.
Selected sustainable securities market indices turned in mixed results
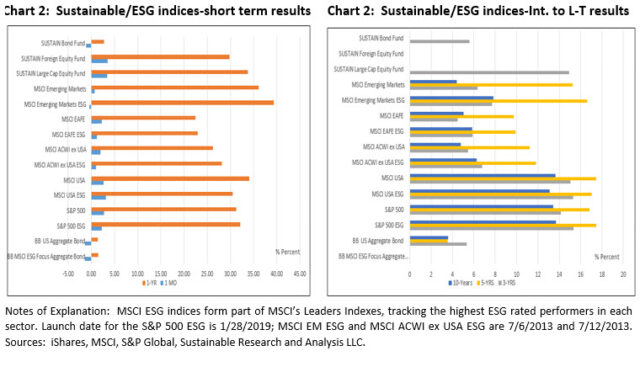
Selected sustainable securities market indices that track stocks and bonds turned in mixed results in February. Refer to Chart 2.
US Stocks[1]. The MSCI USA ESG Leaders Index beat the MSCI USA Index by 54 bps in February. Unlike its foreign counterparts over the one-year as well as intermediate-to-long-term intervals, however, the benchmark continues to lag over the 1-year, 5-years and 10-year time horizons to February 2021. The three-year interval is an exception as the index now outperforms the MSCI USA Index by 24 bps.
Global and International Stocks. Three MSCI ESG Leaders indices tracking developed and developing markets outside the US and Canada lagged their non-ESG counterparts in February, falling short by a range from 98 bps to 118 bps. The same three benchmarks remain consistently ahead over the 1, 3, 5 and 10-year trailing time intervals. The widest divergence in returns is exhibited by the MSCI Emerging Markets ESG Leaders Index that has recorded a substantial positive 3.43% variance over the 10-years to February 2021.
US Fixed Income. The Bloomberg Barclays ESG Focus Aggregate Bond Index managed to eke out a 1 basis point advantage in February relative to the non-ESG counterpart. It also leads during the trailing 1-year interval.
Actively managed sustainable mutual fund indices beat their comparative securities-based non-ESG indices in February and lead over the trailing one and three-year intervals
Total returns achieved by actively managed sustainable funds, on the basis of three Sustainable (SUSTAIN) fund indices that track the largest sustainable funds by category, exceeded the results achieved by their comparative securities-based non ESG indices in February by a range from 0.35% to 1.6%. Of 30 funds tracked across the three SUSTAIN indices, 24 individual funds outperformed their conventional securities-based benchmarks, for a ratio of 80%. SUSTAIN Index returns also outperformed during the trailing 1 and 3-year time intervals, in the cases of the SUSTAIN Large Cap Equity Fund Index and SUSTAIN Bond Fund Index where track records exist and to a trailing 1-year interval for the SUSTAIN Foreign Fund Index. This record of achievement distinguishes the three SUSTAIN Indices from actively managed funds and their performance to December 31, 2020 as reported by S&P Dow Jones Indices’ SPIVA U.S. Scorecard that was released last week[2]. According to the SPIVA U.S. Scorecard, 60.33% and 69.71% of large-cap equity funds lagged corresponding indices during the one-year and three-year periods ending at year-end 2020. International funds were not far behind, with 54.62% and 63.30% of actively managed funds underperforming during one to three-year periods. Investment grade intermediate funds posted better relative results, as 44.55% and 33.51% of actively managed funds underperformed during the one and three-year intervals.
Sustainable (SUSTAIN) Large Cap Equity Fund Index beats the S&P 500 Index by 69 bps
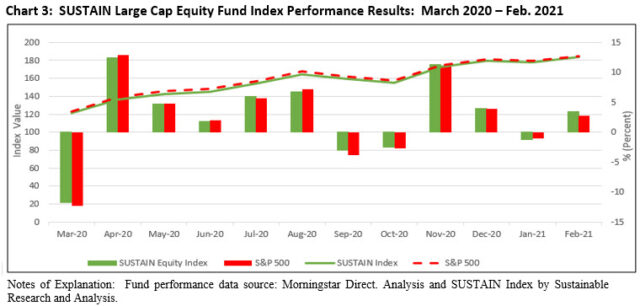
Reversing last month’s trailing performance, the SUSTAIN Large Cap Equity Fund Index gained 3.45% versus the 2.76% gain for the S&P 500, for a positive differential of 69 bps. The corresponding S&P 500 ESG Index was up 2.25%. The SUSTAIN index benefited from the excess benchmark results achieved by seven funds that posted gains ranging from 3.21% to 5.65%. Pioneer Fund A erased last month’s -1.70% decline by adding 5.65% in February. Bringing up the rear was the ClearBridge Appreciation Fund A with its gain of 1.73%.
In addition to its lead relative to the S&P 500 in February, the SUSTAIN Large Cap Equity Fund Index has managed to outperform its benchmark since the start of the year, trailing 12-months and trailing 3-years with its returns of 2.16%, 33.74% and annualized return of 14.9% versus the S&P 500 that is was up 1.72%, 31.29% and 14.1% (average annual), in that order. Refer to Chart 3.
Sustainable (SUSTAIN) Foreign Fund Index beat the MSCI ACWI ex USA Index by a wide 1.6%
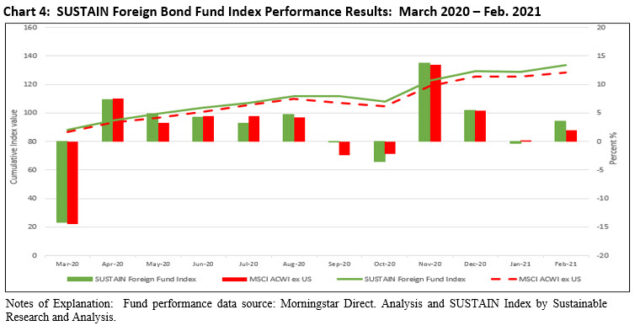
The SUSTAIN Foreign Fund Index turned in a strong outcome in February, posting a total return of 3.53% versus 1.98% recorded by the MSCI ACWI ex USA Index, for a positive differential of 1.6%. All but one fund that makes up the index, or nine of 10 funds, surpassed the conventional benchmark. BlackRock International Investment Fund A lead with a strong 6.22% return while JPMorgan International Focus Fund R6 brought up the rear with a return of 1.88%.
The SUSTAIN Foreign Fund Index has also pulled ahead on a year-to-date, trailing 12-months and since inception (June 2019) basis, with returns of 3.17%, 29.77% and 33.54%, in that order. Refer to Chart 4.
Sustainable (SUSTAIN) Bond Fund Index beat the Bloomberg Barclays US Aggregate Bond Index for the 11th consecutive month
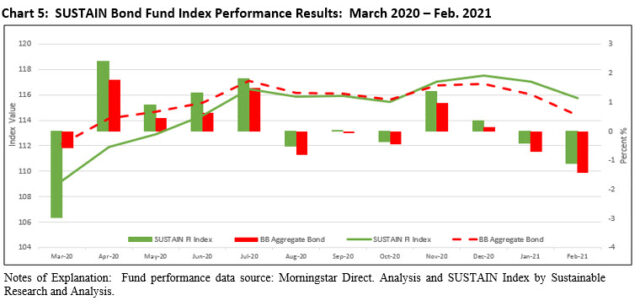
February was a challenging month for bonds, but still, the SUSTAIN Bond Fund Index managed to notch its 11th consecutive month of outperformance relative to the Bloomberg Barclays US Aggregate Bond Index with its -1.01% return versus -1.44%, for a positive variance of 0.43%.
Eight funds posted returns equal to or in excess of -1.36% that beat the Bloomberg Index, led by Neuberger Berman Strategic Income Fund I that gave up -0.04%. The laggard was the Goldman Sachs Core Fixed Income Fund P that recorded a decline of -1.8%.
The SUSTAIN Bond Fund Index also leads it conventional comparative index since the start of the year and also over the trailing 12-months and 3-years with returns of -1.50%, 2.75% and 5.6% (average annual), respectively. Refer to Chart 5.
[1] It should be noted that the S&P 500 ESG Index underperformed the S&P 500 Index in February by 51 bps.
[2] Source: SPIVA U.S. Scorecard 2020, S&P Dow Jones Indices
S&P 500 gained 2.76% in February while active sustainable fund managers prevailed
The Bottom Line: With some volatility during the month, the S&P 500 gained 2.76% in February while active sustainable fund managers beat comparative conventional indices.
Share This Article:
The Bottom Line: With some volatility during the month, the S&P 500 gained 2.76% in February while active sustainable fund managers beat comparative conventional indices.
With some volatility during the month, S&P gains 2.76% in February while active sustainable fund managers beat comparative conventional indices
Government spending, aggressive monetary policy, low interest rates, coronavirus optimism and rising corporate earnings were some of the reasons US stocks gained upward momentum during the first ten trading days of the month, adding some 5.9% until February 16th. But rising bond yields and inflation concerns overcame improving economic data to produce a follow-on -3.1% decline. This occurred during the succeeding nine trading days of the month that ended with the passage by the House of the Biden administration’s $1.9 trillion coronavirus relief package, including a $1,400 direct payment to many Americans, and sending it on to the Senate. In the end, after ticking up briefly before February 26th, the S&P ended the month up 2.76% on a total return basis (2.6% price only). Refer to Chart 1. The Dow Jones Industrial ended higher, posting a 3.4% gain while the NASDAQ Composite added 1%. Value eclipsed growth, with small cap value stocks recording a gain of 10.8%, according to the S&P 600 Value Index while small cap stocks in general outperformed large cap and mid cap stocks. The energy sector across the range of market caps delivered strong results, ranging from 18.8% to 24.1% achieved by small cap energy stocks, followed by financials, up between 11% and 12%.
The anticipation of strong economic growth on the back of stepped up vaccination efforts along with unprecedented fiscal and monetary stimulus fueled concerns about higher inflation that, in turn, led to rising yields. The 10-year Treasury gained 33 bps to end February at 1.44%–a level not observed since February of 2020. Against this backdrop, the Bloomberg Barclays US Aggregate Bond Index gave up -1.44%–the worst monthly decline since November 2016. Higher quality bonds in general ended up in the red, with steeper declines affecting longer dated securities. On the other hand, lower rated bonds posted narrow gains.
Fears of faster-than-anticipated interest rate increases are likely to produce episodes of heightened financial market volatility over the course of 2021 as the recovery from last year’s recession gains steam.
For the most part, global and international equity markets posted positive results in February. The MSCI ACWI ex USA Index gained 1.98% while the MSCI EAFE Index and MSCI Emerging Markets Index were up 1.19% and 0.76%, respectively. France and Germany gained 5.0% and 2.1% while Brazil and China gave up -6.3% and -1.0% in that order.
Selected sustainable securities market indices turned in mixed results
Selected sustainable securities market indices that track stocks and bonds turned in mixed results in February. Refer to Chart 2.
US Stocks[1]. The MSCI USA ESG Leaders Index beat the MSCI USA Index by 54 bps in February. Unlike its foreign counterparts over the one-year as well as intermediate-to-long-term intervals, however, the benchmark continues to lag over the 1-year, 5-years and 10-year time horizons to February 2021. The three-year interval is an exception as the index now outperforms the MSCI USA Index by 24 bps.
Global and International Stocks. Three MSCI ESG Leaders indices tracking developed and developing markets outside the US and Canada lagged their non-ESG counterparts in February, falling short by a range from 98 bps to 118 bps. The same three benchmarks remain consistently ahead over the 1, 3, 5 and 10-year trailing time intervals. The widest divergence in returns is exhibited by the MSCI Emerging Markets ESG Leaders Index that has recorded a substantial positive 3.43% variance over the 10-years to February 2021.
US Fixed Income. The Bloomberg Barclays ESG Focus Aggregate Bond Index managed to eke out a 1 basis point advantage in February relative to the non-ESG counterpart. It also leads during the trailing 1-year interval.
Actively managed sustainable mutual fund indices beat their comparative securities-based non-ESG indices in February and lead over the trailing one and three-year intervals
Total returns achieved by actively managed sustainable funds, on the basis of three Sustainable (SUSTAIN) fund indices that track the largest sustainable funds by category, exceeded the results achieved by their comparative securities-based non ESG indices in February by a range from 0.35% to 1.6%. Of 30 funds tracked across the three SUSTAIN indices, 24 individual funds outperformed their conventional securities-based benchmarks, for a ratio of 80%. SUSTAIN Index returns also outperformed during the trailing 1 and 3-year time intervals, in the cases of the SUSTAIN Large Cap Equity Fund Index and SUSTAIN Bond Fund Index where track records exist and to a trailing 1-year interval for the SUSTAIN Foreign Fund Index. This record of achievement distinguishes the three SUSTAIN Indices from actively managed funds and their performance to December 31, 2020 as reported by S&P Dow Jones Indices’ SPIVA U.S. Scorecard that was released last week[2]. According to the SPIVA U.S. Scorecard, 60.33% and 69.71% of large-cap equity funds lagged corresponding indices during the one-year and three-year periods ending at year-end 2020. International funds were not far behind, with 54.62% and 63.30% of actively managed funds underperforming during one to three-year periods. Investment grade intermediate funds posted better relative results, as 44.55% and 33.51% of actively managed funds underperformed during the one and three-year intervals.
Sustainable (SUSTAIN) Large Cap Equity Fund Index beats the S&P 500 Index by 69 bps
Reversing last month’s trailing performance, the SUSTAIN Large Cap Equity Fund Index gained 3.45% versus the 2.76% gain for the S&P 500, for a positive differential of 69 bps. The corresponding S&P 500 ESG Index was up 2.25%. The SUSTAIN index benefited from the excess benchmark results achieved by seven funds that posted gains ranging from 3.21% to 5.65%. Pioneer Fund A erased last month’s -1.70% decline by adding 5.65% in February. Bringing up the rear was the ClearBridge Appreciation Fund A with its gain of 1.73%.
In addition to its lead relative to the S&P 500 in February, the SUSTAIN Large Cap Equity Fund Index has managed to outperform its benchmark since the start of the year, trailing 12-months and trailing 3-years with its returns of 2.16%, 33.74% and annualized return of 14.9% versus the S&P 500 that is was up 1.72%, 31.29% and 14.1% (average annual), in that order. Refer to Chart 3.
Sustainable (SUSTAIN) Foreign Fund Index beat the MSCI ACWI ex USA Index by a wide 1.6%
The SUSTAIN Foreign Fund Index turned in a strong outcome in February, posting a total return of 3.53% versus 1.98% recorded by the MSCI ACWI ex USA Index, for a positive differential of 1.6%. All but one fund that makes up the index, or nine of 10 funds, surpassed the conventional benchmark. BlackRock International Investment Fund A lead with a strong 6.22% return while JPMorgan International Focus Fund R6 brought up the rear with a return of 1.88%.
The SUSTAIN Foreign Fund Index has also pulled ahead on a year-to-date, trailing 12-months and since inception (June 2019) basis, with returns of 3.17%, 29.77% and 33.54%, in that order. Refer to Chart 4.
Sustainable (SUSTAIN) Bond Fund Index beat the Bloomberg Barclays US Aggregate Bond Index for the 11th consecutive month
February was a challenging month for bonds, but still, the SUSTAIN Bond Fund Index managed to notch its 11th consecutive month of outperformance relative to the Bloomberg Barclays US Aggregate Bond Index with its -1.01% return versus -1.44%, for a positive variance of 0.43%.
Eight funds posted returns equal to or in excess of -1.36% that beat the Bloomberg Index, led by Neuberger Berman Strategic Income Fund I that gave up -0.04%. The laggard was the Goldman Sachs Core Fixed Income Fund P that recorded a decline of -1.8%.
The SUSTAIN Bond Fund Index also leads it conventional comparative index since the start of the year and also over the trailing 12-months and 3-years with returns of -1.50%, 2.75% and 5.6% (average annual), respectively. Refer to Chart 5.
[1] It should be noted that the S&P 500 ESG Index underperformed the S&P 500 Index in February by 51 bps.
[2] Source: SPIVA U.S. Scorecard 2020, S&P Dow Jones Indices
Sustainableinvest.com
Benefits
Free access to regularly updated original research and analysis focused exclusively on sustainable finance and investing, providing investors with the guidance needed to make informed investment decisions that align with their personal values and financial goals while also contributing to the advancement of positive long-term environmental and social outcomes.
By offering financial support for our current work, either in the form of a one-time or regular contributions, you help to defray some of the costs associated with conducting our research and analysis as well as to maintain the www.sustainableinvest.com website.
Helping us to expand our research capabilities and offerings over time to cover additional relevant topics geared to sustainable investors.
Sign up to free newsletters.
By submitting this form, you are consenting to receive marketing emails from: . You can revoke your consent to receive emails at any time by using the SafeUnsubscribe® link, found at the bottom of every email. Emails are serviced by Constant Contact