The Bottom Line: Intermediate and long-term investors should be encouraged in the continuing knowledge that ESG investing can be pursued without negatively impacting financial outcomes.
August summary: Notching its seventh consecutive monthly gain, the S&P 500 posted a much better than average increase of 3.04% total return
Notching its seventh consecutive monthly gain, the S&P 500 posted a much better than average increase of 3.04% total return in August. The Dow Jones Industrial Average gained 1.5% while the NASDAQ Composite added 4.08%. Bolstered by an extraordinarily robust economic rebound, stronger than expected corporate earnings and signaling by the Federal Reserve that it intends to keep interest rates low, stocks moved higher in 15 of the month’s 22 trading days. Concerns about inflation, risks due to the COVID Delta variant and increasing number of infections, hospitalizations and deaths as well as deteriorating fundamentals and decelerating growth in the coming months all seemed to take a back seat. After giving up much of its monthly gain by August 18th, stocks rebounded during the remainder of the month to add 2.9% on a price basis. Refer to Chart 1. The gain was powered by large cap growth stocks that outperformed value well as small cap stocks. The S&P SmallCap 600 Index added 2.02%.

Overseas, stocks lagged their US counterparts. The MCI ACWI ex USA recorded a gain of 1.9%, with Europe and the Far East adding 2.57% and emerging markets posting a stronger 2.62% increase. Leading in emerging markets, India gained 10.94% according to the MSCI India Index, while China was flat.
Against a backdrop of rising 10-year Treasury yields that picked up 6 bps to end the month at 1.30%, investment-grade intermediate bonds, as measured by the now renamed Bloomberg US Aggregate Bond Index, gave up -0.19% after posting four consecutive monthly gains. High yield corporate bonds were up 0.51%.
Sustainable funds, mutual funds and ETFs¹, a total of 1,067 investment funds covering all asset classes, gained an average 1.9% with results ranging from a high of 22.52% recorded by the newly launched $10.2 million Viridi Clean Energy Crypto-Mining and Semiconductor ETF to a low of -4.24% posted by Krane UBS China A Shares Fund I. At the same time, sustainable fund indices turned in mixed results, with domestic sustainable large cap equity funds lagging by 52 bps, foreign funds matching the performance of the conventional MSCI ACWI ex USA ESG Index while bond funds outperformed by 18 bps. Combined with the overall results achieved by ESG-oriented securities market indices, especially over the intermediate and long-term, investors should be encouraged in the continuing knowledge that ESG investing strategies, subject to standard selection methods, can be pursued without negatively impacting financial outcomes.
Sustainable securities market indices: Four of the six tracked sustainable indices outperformed their conventional counterparts
Based on an evaluation of six sustainable securities market indices computed by or with inputs from MSCI (all ESG Leaders indices in the case of equities and ESG Focus in the case of fixed income) four of the six indices outperformed their conventional counterparts. Refer to Table 1 and Chart 2. Exceptions include investment-grade intermediate bonds and small cap stocks that lagged by a very narrow 1 bps and 50 bps, respectively.
Over the intermediate-to-long term, i.e. three years and beyond, total return performance results remain more consistent for foreign securities than US based securities. All three foreign indices consistently beat out their conventional counterparts. This is not the case for large cap and small cap stocks. It should also be noted that rating or scoring methodologies across index providers lead to varying index results. For example, the S&P 600 SmallCap ESG Index outperforms its conventional counterpart over the 1, 3, 5 and 10-year intervals. This is not the case for the MSCI USA Small Cap ESG Leaders Index.

Mixed results for sustainable mutual fund indices: Equity funds lagged, foreign funds came in even and bond funds outperformed
The following results were recorded by the Sustainable (SUSTAIN) Large Cap Equity Fund Index, the Sustainable (SUSTAIN) Foreign Fund Index and the Sustainable (SUSTAIN) Bond Fund Index:Sustainable (SUSTAIN) Large Cap Equity Fund Index: +2.52%
Registering the seventh consecutive positive gain, the SUSTAIN Large Cap Equity Fund Index recorded a return of 2.52% and underperformed the S&P 500 Index by 52 bps. So far this year, the sustainable fund index trailed the S&P 500 in five of the last eight calendar months. That said, the SUSTAIN fund index continues to maintain its lead over the trailing three years with its average annualized return of 18.46% versus 18.07%. Refer to Chart 3.

Only one fund outperformed both the S&P 500 this month, namely the T. Rowe Price Blue Chip Growth Fund. The nine other constituent funds generated returns ranging from 1.81% posted by the Hartford Capital Appreciation Fund A to 2.82% achieved by the Eventide Gilead Fund I.
Sustainable (SUSTAIN) Bond Fund Index: -0.01%
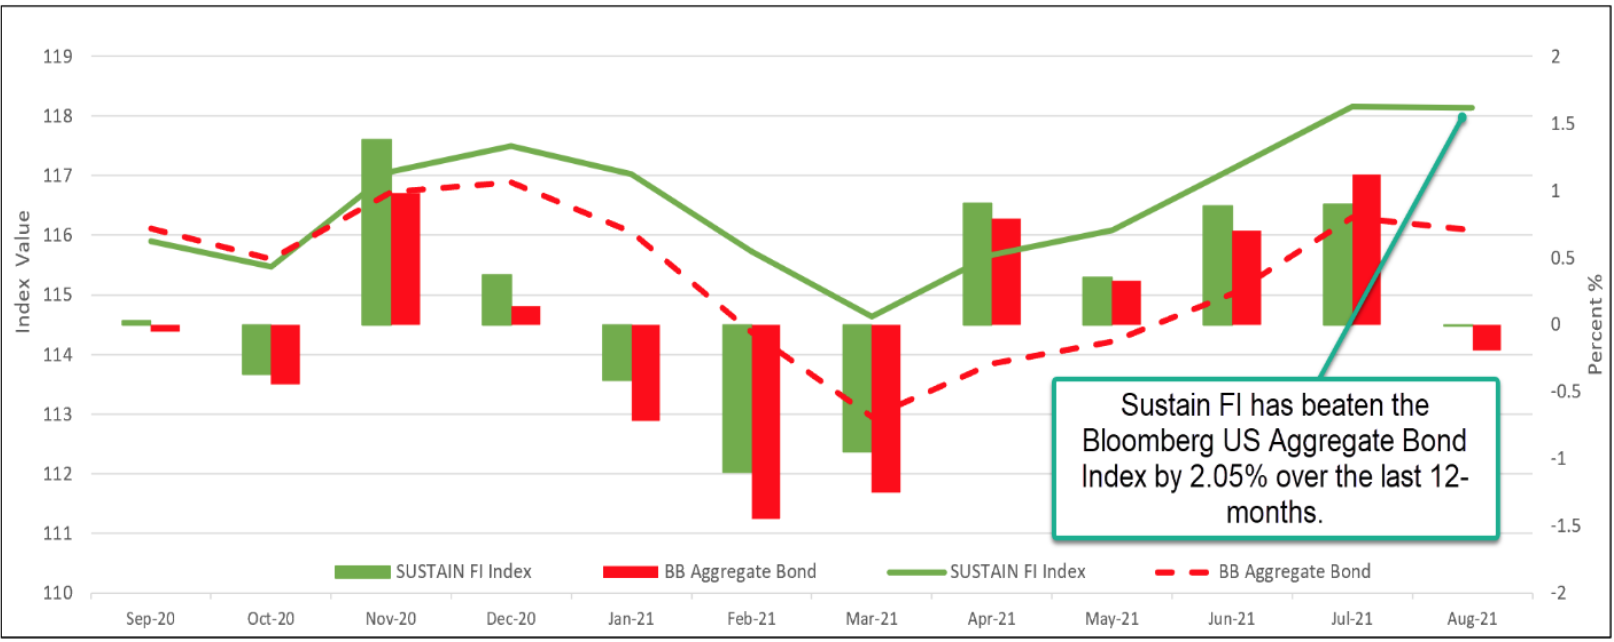
The Sustainable Bond Fund Index regained its mojo and beat the Bloomberg US Aggregate Bond Index by 18 bps in August. In doing so, the sustainable funds benchmark resumed its streak of achieving 15 consecutive months of outperformance that was only interrupted in July. The SUSTAIN Index gained 0.01% versus -0.19% recorded by the Bloomberg US Aggregate Index as all ten constituent funds beat the conventional benchmark. The Neuberger Berman Strategic Income Fund I led with a 0.32% return while at the other end of the range the TIAA-CREF Core Impact Bond Fund Institutional gave up -0.15%. Refer to Chart 4.

The SUSTAIN Index has delivered strong short-to-intermediate-term results and leads the conventional intermediate investment grade index over the latest quarter, 1-year and 3-year intervals. The SUSTAIN Index has been calculated since December 2017.
Sustainable (SUSTAIN) Foreign Fund Index: +1.9%
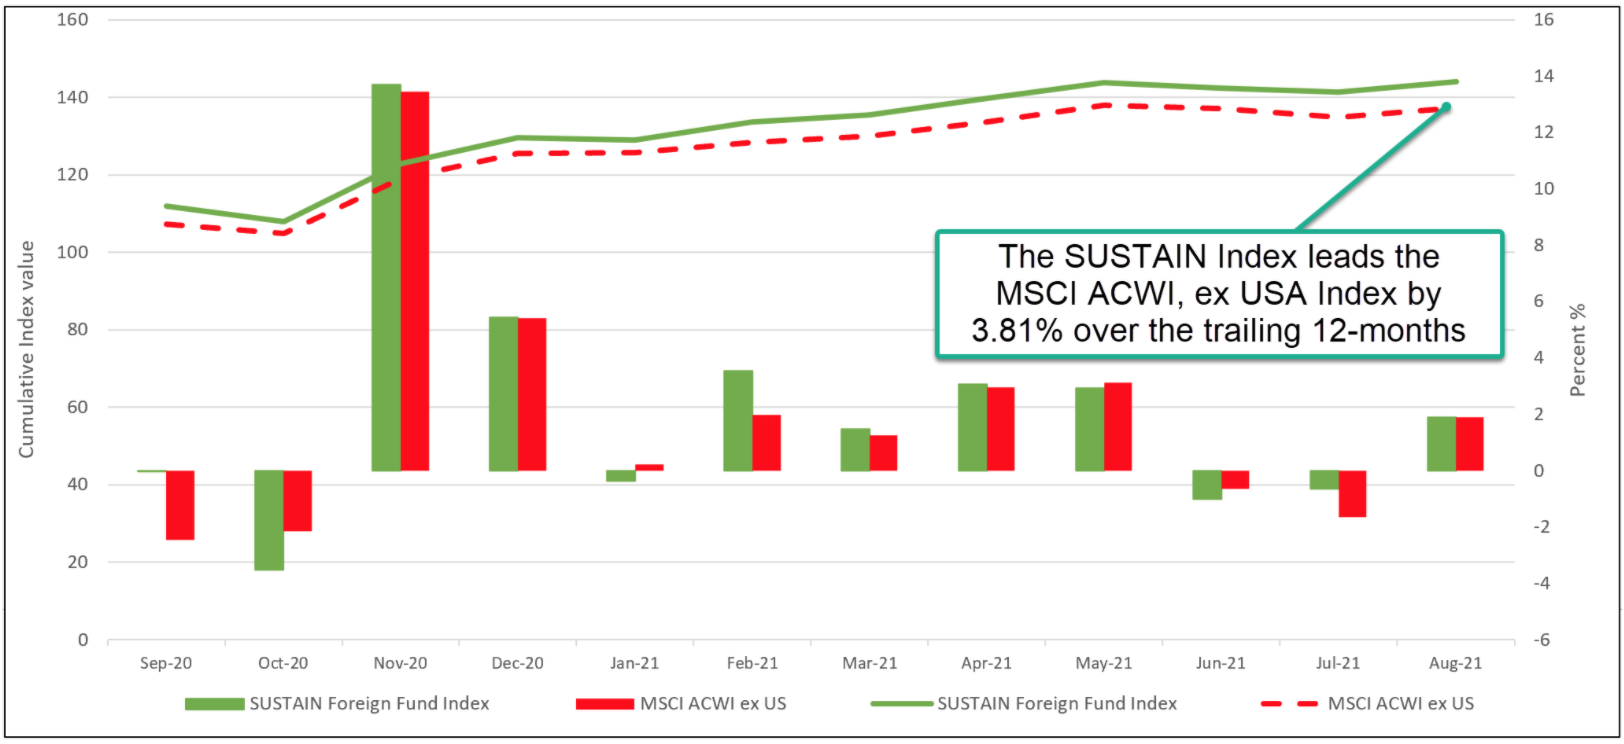
The SUSTAIN Foreign Fund Index matched the results achieved by the MSCI ACWI ex USA Index in August. The SUSTAIN Index posted a gain of 1.9% versus 1.90% recorded by the conventional securities market index. The SUSTAIN Index continues to maintain its lead on a trailing 3-month and 12-month basis, leading by 64 bps and a wide 3.81%, in that order. Refer to Chart 5.

Five constituent funds outperformed the conventional benchmark, posting returns ranging from 2.01% to 2.94% registered by the Hartford International Opportunities Fund Y. Bringing up the rear was the Templeton Foreign Fund A at 0.91%.
| Index Name | 1 MO (%) | 3-M(%) | 1-YR(%) | 3-YRS(%) | 5-YRS(%) | 10-YRS (%) |
| Bloomberg MSCI ESG Focus Aggregate Bond | -0.20 | 1.65 | -0.05 | |||
| Bloomberg US Aggregate Bond | -0.19 | 1.63 | -0.08 | 5.43 | 3.11 | 3.18 |
| S&P 500 ESG | 3.12 | 8.61 | 30.27 | 19.39 | 18.76 | 16.66 |
| S&P 500 | 3.04 | 7.95 | 31.17 | 18.07 | 18.02 | 16.34 |
| MSCI USA ESG | 3.08 | 8.93 | 33.59 | 19.77 | 18.36 | 16.1 |
| MSCI USA | 2.95 | 8.32 | 31.86 | 18.82 | 18.47 | 16.51 |
| MSCI USA Small Cap ESG | 1.68 | 0.96 | 47.02 | 10.28 | 13.12 | 12.6 |
| MSCI USA Small Cap | 2.18 | 1.30 | 46.99 | 11.09 | 13.65 | 12.94 |
| MSCI ACWI ex USA ESG | 2.47 | 0.55 | 23.85 | 10.73 | 10.54 | 7.93 |
| MSCI ACWI ex USA | 1.90 | -0.43 | 24.87 | 9.37 | 9.92 | 6.57 |
| MSCI EAFE ESG | 2.57 | 2.63 | 25.37 | 10.22 | 10.07 | 8.08 |
| MSCI EAFE | 1.76 | 1.38 | 26.12 | 9 | 9.72 | 7.34 |
| MSCI Emerging Markets ESG | 2.75 | -3.77 | 18.74 | 11.65 | 11.59 | 7.62 |
| MSCI Emerging Markets | 2.62 | -4.12 | 21.12 | 9.87 | 10.4 | 4.85 |
| SUSTAIN Large Cap Equity Fund Index | 2.52 | 7.70 | 31.0 | 18.46 | ||
| SUSTAIN Foreign Equity Fund Index | 1.90 | 0.21 | 28.68 | |||
| SUSTAIN Bond Fund Index | -0.01 | 1.78 | 1.97 | 6.0 |


