The announced launch of the S&P 500 ESG Index on April 8, 2019 gives investors yet another benchmark or tool with which to evaluate the performance of the large cap equity market in the US, qualified on the basis of minimum ESG scores and company exclusions. In this instance, the conventional S&P 500 index has been modified based on the achievement of minimum ESG scores calculated by SAM of RobecoSAM AG, that are further refined by S&P Dow Jones Indices (S&P DJI) to depict a company’s overall ESG sensitivity relative to other companies categorized in the same industry. Further, the companies that make up the index are screened to exclude certain firms based on their activities or low scores relative to the United Nations Global Compact Scores. The new index adds to a growing complement of ESG oriented benchmarks that allows investors to track important segments of the financial markets through a sustainable investing lens that encompass one or some combination of strategies, such as values-base, negative screening, ESG integration, thematic and/or impact investing. In particular, such indices cover equity and fixed income market segments and are now offered by firms like MSCI, FTSE, and Bloomberg, to mention some of the leaders in the ESG index space. In addition to tracking the performance of markets through a sustainable investing strategy lens, these benchmarks will also gain usage for relative performance evaluation purposes and the creation of investment products. For example, UBS Asset Management has already launched for trading on the London Stock Exchange the first ETF based on the new S&P index. This is in addition to at least 129 mutual funds and ETS that seek to replicate the performance of ESG indexes. Also, it may be that, in time, these could also be used as secondary or supplemental benchmarks much in the same way as more narrowly-based market sector indexes are in use today alongside primary or broad-based indices. At the same time, ESG index traction will also stimulate demand for the underlying ESG scores. Once established, these applications can generate significant revenue streams for the index providers. So there will undoubtedly be a rush to create many more such indexes and to establish market dominance. As is the case with all indices, however, competing firms employ their own methodologies that, in turn, influence the profile and performance of any given index. This outcome may be even more pronounced for indexes that are qualified on the basis of sustainable and/or ESG considerations. These are based on ESG scoring and negative screening practices that, in the absence of formal definitions and varying scoring methodologies, fluctuate across ESG rating firms and will affect the composition of the corresponding index. Investors should understand and carefully evaluate these benchmarks, their approaches as well as methodologies before adopting them for relative performance evaluation purposes and other uses.
Index relies on SAM Corporate Sustainability Assessments as refined by S&P/DJI
S&P DJI ESG scores are based on SAM’s Corporate Sustainability Assessment that are designed to “identify companies well-equipped to recognize and respond to emerging sustainability opportunities and challenges in the global market.” The analysis depends on responses that companies provide annually in the form of industry specific questionnaires that, according to SAM, evaluate a range of financially relevant sustainability criteria. In the absence of company responses, SAM relies on publicly available information that is collected by its analysts and evaluated. Scores are further informed by means of information derived from daily updates provided by RepRisk that monitors companies’ sustainability performance with regard to issues such as economic crime or corruption, fraud, illegal commercial practices, human rights issues, labor disputes, workplace safety, catastrophic accidents or environmental violations. For purposes of evaluating the eligibility of companies in the S&P 500 index, SAM’s final scores are further refined in collaboration with S&P DJI.
In addition, companies conducting certain business activities and/or companies that are disqualified based on United Nations Global Compact Scores are excluded from the index, as follows:
“¢ Tobacco company exclusions. Companies that either directly, or via an ownership stake of 25% or more or another company produce tobacco, have tobacco sales accounting for greater than 10% of their revenue, or have tobacco-related products & services accounting for greater than 10% of their revenue. The companies are identified using Sustainalytics data.
“¢ Controversial weapons. Companies that either directly, or via an ownership stake of 25% or more of another company, are involved with cluster weapons, landmines (anti-personnel mines) and biological or chemical weapons, depleted uranium weapons, white phosphorus weapons, and nuclear weapons. The companies are identified using Sustsainalytics data.
“¢ Low United National Global Compact (UNGC) Scores. Companies with disqualifying United Nations Global Compact scores that are ranked in the bottom 5% of the GC universe globally, based on Arabesque’s S-RayTM universe which is used to assess very poor performers in relation to the UN Global Compact Principles. The reference date for S-RayTM GC scores is the last business day of March.
Companies with an S&P DJI ESG score that falls within the worst 25% of ESG scores from each Global Industry Classification Standard (GICS) Group are excluded from the index. In addition, if a company does not have an S&P DJI ESG score, then it is excluded from the index. After their qualification, index constituents are weighted in the index using a float-adjusted market capitalization approach.
Ratings/scores for a single company or entity can vary widely across different firms
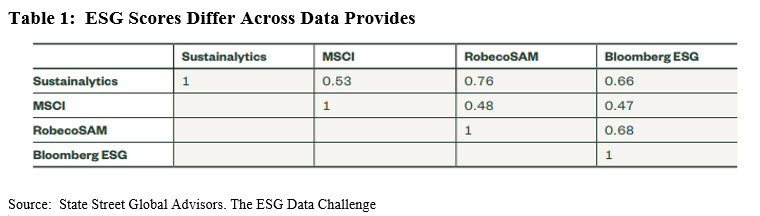
It should be noted that SAM is one of an estimated 125 or so ESG data provider firms operating across the world, that also include organizations like MSCI, Sustainalytics, Bloomberg, FTSE, Refinitiv (Thomson Reuters), Vigeo Eiris and ISS, to mention a few of the more prominent firms. Each of these firms collect and score companies as well as other entities based on varying ESG factors and methodologies. As a result, ratings for a single company or entity can vary widely across different companies. While not the only research to reach this conclusion, according to research conducted by State Street across 30 data providers using cross-sectional correlations to quantify the degree to which this lack of standardization leads to variance among ESG scores, correlations among their scores can range from 0.48 to 0.76. That is to say, the ratings across companies are only consistent about half the time and as high as three-quarters of the time. This means that fundamental index construction methodologies aside, indexes constructed using data from RobecoSAM or MSCI could end up with very different index constituents once the eligible universe of securities is qualified on the basis of ESG scores and exclusions. Further, differing methodologies have important implications for investors generally and the indexes they may choose. “In choosing a particular provider, investors are, in effect, aligning themselves with the company’s ESG investment philosophy, in terms of data acquisition, materiality, and aggregation and weighting.” But it goes even beyond this in that the ESG indexes likely reflect a particular providers’ values-based system. Refer to Table 1.
S&P 500 ESG Index Profile: Targets 75% of float market capitalization of conventional S&P 500 market cap at the industry level
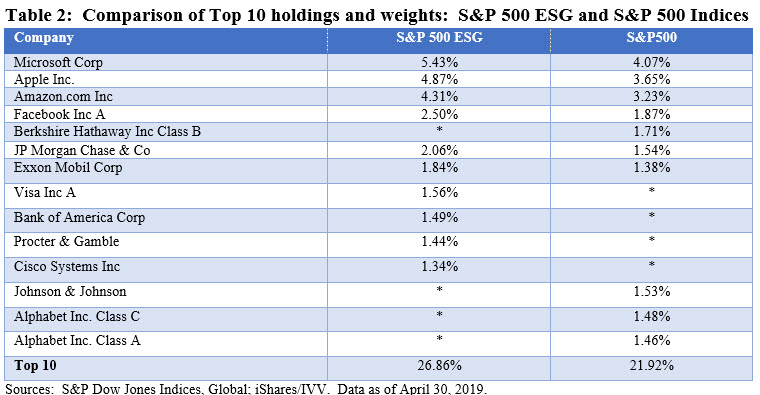
According to S&P, the new index is intended to maintain overall group weightings relative to the S&P 500 and will target 75% of the float market capitalization of the conventional S&P 500 market capitalization at the industry level. That said, the S&P 500 ESG index tracks 329 holdings as of April 30, 2019 versus 509 member firms as of the same date for the S&P 500. The top 10 positions vary by composition and weighting, with the top 10 spots in the ESG version of the index accounting for about 27% of the index weight versus 22%. Excluded entirely from the S&P 500 ESG index are Berkshire Hathaway Inc., Johnson and Johnson as well as Alphabet Class A and C. At the same time, Exxon Mobil Corp. has a 46 bps greater exposure in the S&P 500 ESG Index versus its conventional counterpart. Refer to Table 2.
S&P 500 ESG Index industry sector breakdown similar to conventional index
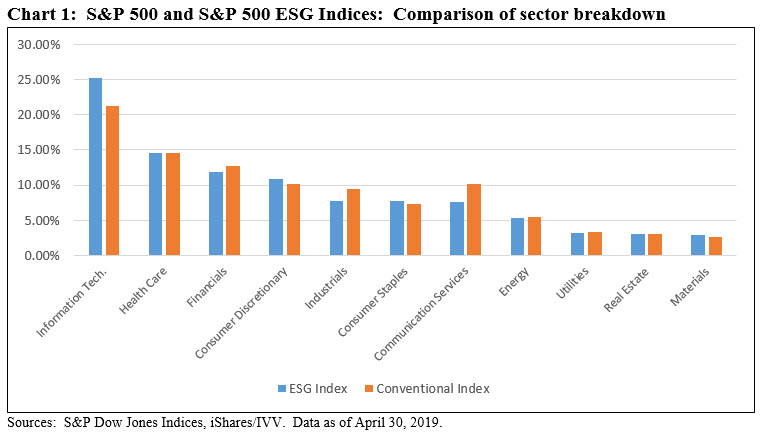
For the most part, the conventional index and the S&P 500 ESG counterpart index reflect similar sector breakdowns and variations within 8 of the 11 industry sectors are within 80 bps. In the case of Information Technology, Communications Services and Industrials, however, the variations are 4.1%, 2.50% and 1.8%, respectively.
Regardless of these variations, within each of the sectors, individual constituents will fluctuate as to names and weights. For example, in the Utilities sector that varies by only 10 bps, the S&P 500 ESG index tracks constituents versus 28 for the conventional S&P 500. In the Financial sector, the S&P 500 ESG tracks 45 names versus 67 names covered in the conventional S&P 500 index, or a difference of 22 names. Berkshire Hathaway, with a weight in the conventional index of 1.7% is omitted entirely from the S&P 500 ESG index.
The weights of firms like JP Morgan Chase & Co., and Bank of America Corp., both top 10 firms in the S&P 500 ESG index, stand at 2.06% and 1.49%, respectively, while the same names are calibrated with weights of 1.54% and 1.12% in the conventional S&P 500 index. Refer to Chart 1.
S&P 500 ESG Index Total Return Performance
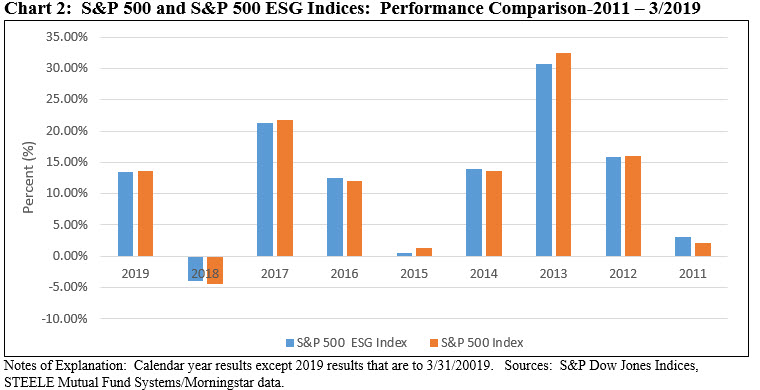
While the official launch date of the S&P 500 ESG index was January 28, 2019, its total return performance was back dated to April 30, 2010, based on the methodology that was in effect as of the launch date. Tracking their performance year-by-year, the results are similar and fall within a range of 85 basis points, except in 2013 and 2011 when one or the other index varied by as much as 175 bps.
Cumulatively through March 29, 2019, the conventional S&P 500 exceeds the performance of the S&P 500 ESG index by 1.3%. That said, it should be kept in mind that the results achieved prior to the launch of the index are hypothetical as company ESG scores have not been back casted.
Based on a set of contemporaneous ESG scores, the S&P 500 ESG index posted a gain of 13.50% in the first quarter of 2019 versus a gain of 13.65% for the conventional index–for a difference of 15 basis points. Refer to Chart 2.
Investors should understand and carefully evaluate ESG indices, their approached and methodologies before adopting them for relative performance evaluation purposes
Comments that appeared in a recent Barron’s article dismiss the index on the grounds that it emphasizes exclusions based on low ESG scores while at the same time ignoring the needs of investors with a values alignment or value impact. Another criticism focused on the fact that the index was not sufficiently tilted toward companies with more women in leadership roles on the basis that all research suggests that more women in leadership help companies perform better.
Our own view is that there is a need for a series of benchmarks designed for managers and portfolios, such as mutual funds and ETFs, managed pursuant to a strategy that relies purely or largely on ESG integration, i.e. the consistent and systematic accounting of ESG risks when these are relevant and material to investment decisions. This, after all, the fastest growing segment of the sustainable investing sector and there is likely growing demand for equity and fixed income benchmarks that track a similar strategies and with limited exposure to negative screening or exclusions. In any case, investors will initially have to understand and carefully evaluate ESG indices, their approached and methodologies before adopting them for relative performance evaluation purposes.