The Bottom Line: The outperformance of selected ESG indices continue to narrow and long-term results are expected to converge and align with their conventional counterparts.
Stocks bounced back in October with a gain of 8.1% while bonds gave up 1.3% as interest rates rose
Stocks bounced back in October, benefiting from corporate earnings reports that exceeded already lowered analyst expectations as well as economic news that came in better than expected. Across large cap, mid cap and small cap stocks, corresponding S&P indices gained 8.1%, 10.53% and 12.37%, respectively. The S&P 500 ESG Index increased by 8.87% versus 8.1% for the conventional index while the MSCI USA ESG Leaders Index added 7.30% and its conventional counterpart posted a gain of 7.94%. Only two of six selected ESG indices outperformed their conventional counterparts in October. Even with strong gains in October, results over the trailing 12-months still reflected steep declines for the S&P 500, S&P MidCap 400 and the S&P SmallCap 600 of 14.61%, 11.81% and 16.67%, in that order.
The S&P 500 Index was off to a strong start, gaining 5.7% during the first two days of October following the release of economic data that gave investors hope regarding a future rate easing on the part of the Federal Reserve. The gains were surrendered over the next six trading days, but the index managed to back track over the course of the remaining thirteen trading days with a gain of 8.2%. Ten of the 11 sectors that comprise the S&P indices posted positive results, except for the large cap Communications Sector. Energy Sector results dominated the three indices, with returns ranging from 22.15% to 28.11% for small cap energy stocks.
Stock gains contrasted sharply with the performance of bonds that repeated their negative performance in October. Intermediate investment-grade bonds, as measured by the Bloomberg US Aggregate Bond Index, dropped 1.3% as yields rose on 10-year Treasuries by 27 bps from 3.83% to 4.10% . Absolute returns in most segments of the bond market were negative. As has been the case all year, shorter-term holdings were the best relative performers. High yield corporate bonds and similar lower-rated bonds outperformed high quality instruments.
Markets overseas trailed the U.S. The MSCI ACWI ex USA Index gained 2.99% and MSCI EAFE rose 5.38%. Largely due to China and Taiwan that dropped 14.76% and 5.05%, respectively, emerging markets gave up another 3.10% after last month’s 11.7% decline.
Chart 1: S&P 500 Index cumulative price only rates of return-October 2022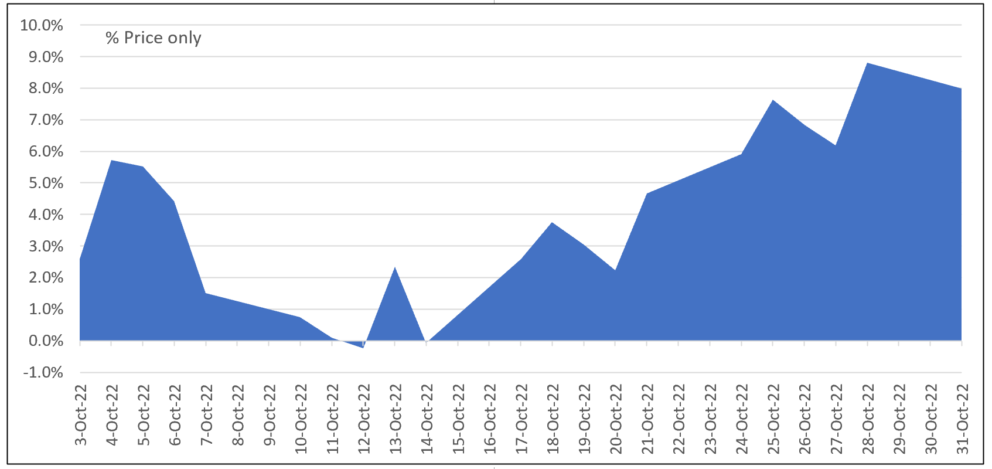 Source: Yahoo Finance
Sustainable mutual funds and ETFs recorded a positive average return of 3.96%, bouncing back from last month’s average -7.8% decline
The universe of sustainable mutual funds and ETFs as defined by Morningstar, a total of 1,316 funds/share classes as of October 30, 2022 with $295.8 billion in assets cross all asset classes, posted an average gain of 3.96% in October and -19.4% for the trailing 12-months.
Equity funds, including domestic, international, and foreign funds, gained an average 5.81% while bond funds dropped 0.45%. Performance results ranged from a low of -17.58% recorded by the $3.6 million KraneShares MSCI China ESG Leaders ETF (KESG) to a high of 13.29% posted by the DFA US Sustainability Targeted Value Institutional Fund (DAABX) with its 41% exposure to small cap value stocks. Even with an outstanding one-month return, the fund remains in negative territory for the trailing 12-month period. Its 5.18% negative results, however, pale in comparison to the -51.34% recorded by KESG.
Top performing funds in October were dominated by small cap equity portfolios with an average blended and value orientation while the worst performing funds were exposed to emerging markets, including China.
Table 1a: Top 10 performing funds Table 1b: Bottom 10 performing funds
|
Fund Name
|
1-M TR
(%)
|
12-M TR (%)
|
Fund Name
|
1-M TR (%)
|
12-M TR (%)
|
|
DFA US Sustainability Targeted Val Instl
|
13.29
|
-5.18
|
Goldman Sachs ESG Em Mkts Eq Inst
|
-4.72
|
-39.66
|
|
Boston Trust Walden Small Cap
|
12.66
|
-5.92
|
Goldman Sachs ESG Emerging Mkts Eq C
|
-4.73
|
-40.29
|
|
Xtrackers S&P SmallCap 600 ESG ETF
|
12.41
|
-10.29
|
Goldman Sachs ESG Emerging Mkts Eq A
|
-4.74
|
-39.89
|
|
SPDR S&P SmallCap 600 ESG ETF
|
12.4
|
|
Goldman Sachs ESG Emerging Mkts Eq R
|
-4.77
|
-40.03
|
|
Columbia US ESG Equity Income ETF
|
12.32
|
1.22
|
Eventide Exponential Technologies A
|
-8.76
|
-40.23
|
|
iShares® ESG Screened S&P Small-Cap ETF
|
12.23
|
-12.47
|
Eventide Exponential Technologies N
|
-8.77
|
-40.29
|
|
Emerge EMPWR Sustainable Div Eq ETF
|
12.06
|
|
Eventide Exponential Technologies C
|
-8.82
|
-40.75
|
|
Praxis Small Cap Index I
|
11.99
|
-15.21
|
Martin Currie International Sust Eq IS
|
-11.36
|
-35.47
|
|
Praxis Small Cap Index A
|
11.98
|
-15.75
|
KraneShares MSCI China Clean Tech ETF
|
-14.12
|
-49.89
|
|
Fidelity® Water Sustainability
|
11.72
|
-18.04
|
KraneShares MSCI China ESG Leaders ETF
|
-17.58
|
-51.34
|
Notes of Explanation: Performance covering both mutual funds and ETFs=total returns in percentage terms for periods ending October 30, 2022. 1-M=1 month, 12-M=12 months. Blank cells=fund was not in operation during entire interval. Source: Morningstar Direct.
The outperformance of selected ESG screened indices continue to narrow in October
Four of six selected MSCI ESG Leaders indices lagged behind their conventional counterparts in October. These selected benchmarks consist of three international and foreign equity indices, two US stock indices and one fixed income index, all of which are comprised of companies with high ESG scores relative to sector peers. This is the fourth month in a row during which four or more of the same six indices trailed, and the seventh month so far in 2022.
For the trailing 1-year interval, five of the six benchmarks underperformed relative to their conventional counterparts. The exception is the MSCI Small Cap ESG Leaders Index that led by 1.99%.
All but the Bloomberg MSCI ESG Focus Aggregate Bond Index now underperform their conventional counterparts over the trailing 3-year time horizon. While some pockets of outperformance persist, for the five- and ten-year intervals the margins of outperformance have narrowed in 2022 through October 31st.
The outperformance of selected ESG screened indices is narrowing and long-term results are expected to converge and align with their conventional counterparts.
Chart 2: Selected sustainable indices intermediate and long-term relative total return performance results to October 30, 2022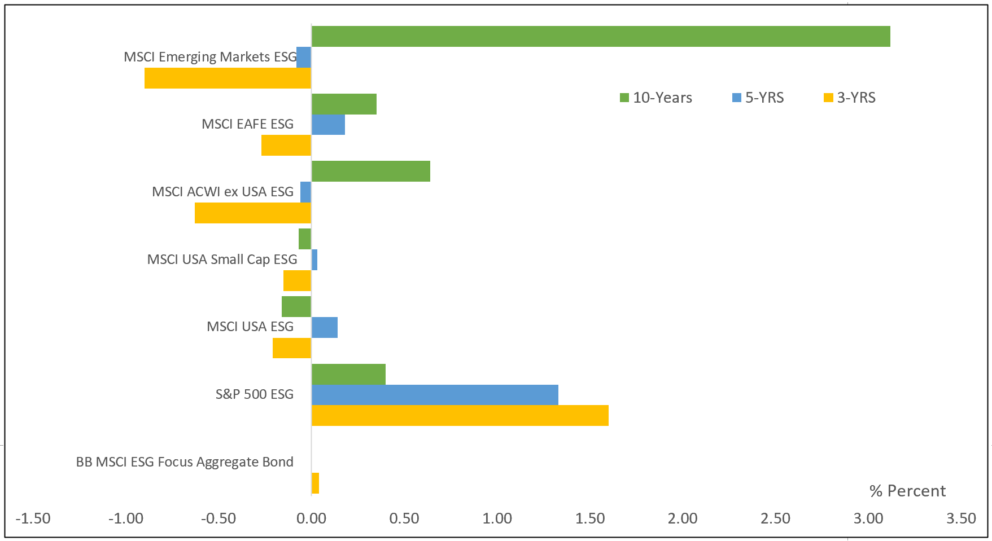 Notes of Explanation: The six MSCI ESG indices include the MSCI USA ESG Leaders Index consisting of large and mid-cap companies, MSCI USA Small Cap ESG Leaders Index, MSCI ACWI, ex USA, Leaders Index consisting of large and mid-cap companies in developed and developing countries, MSCI EAFE ESG Leaders Index consisting of large and mid-cap companies in developed markets. MSCI Leaders indices are constructed to provide exposure to companies with high ESG scores relative to their sector peers. Intermediate term covers 3 and 5 years. Long-term=10 years. Source: MSCI
SRA Select List of funds posted an average gain of 3.0% in October, partly reversing last month’s decline of 6.84%
SRA Select funds posted an average increase of 3.0% in October, equivalent to the 3% average increase registered by their corresponding conventional benchmarks¹. Excluding money market funds, returns ranged from low of -2.73% recorded by the iShares ESG MSCI EM Leaders ETF (LDEM) to a high of 10.09% posted by the iShares ESG Aware MSCI USA Small-Cap ETF (ESML). Refer to Table 2 for a complete rundown of SRA Select list of mutual funds and ETFs and their performance results over several time periods to October 30th.
Consisting of nine funds² pursuing discrete investment strategies intend for use as building blocks in the creation of a diversified ESG-oriented portfolio, seven of the nine funds underperformed their conventional benchmarks in October. Eight of the nine funds trailed for the 12-month interval while six of eight funds underperformed over the trailing three-years³. In both cases, the 12-month and three-year outcomes were the same last month. (Refer to previously published article SRA Select Listing: ESG Integration Investment Fund Q1-2022 https://sustainableinvest.com/sra-select-listing-esg-integration-investment-funds-q1-2022/).
Table 2: Performance of SRA Select listed mutual funds and ETFs-October 2022
Fund name/Index | Expense Ratio (%) | Assets ($ M) | 1-Month Total Return (%) | Y-T-D Total Return (%) | 12-M Total Return (%) | 3-Year TR (%) |
iShares ESG Advanced Hi Yld Corp Bd ETF (HYXF) | 0.35 | 130 | 2.85 | -12.75 | -12.03 | -1.12 |
iShares ESG Aware MSCI EAFE ETF (ESGD) | 0.2 | 6102.4 | 5.68 | -23.82 | -23.82 | -1.24 |
iShares ESG Aware MSCI USA Small-Cap ETF (ESML) | 0.17 | 1462.1 | 10.09 | -15.5 | -16.19 | 8.83 |
iShares ESG U.S. Aggregate Bond ETF (EAGG) | 0.1 | 2040.9 | -1.29 | -15.73 | -15.78 | -3.88 |
iShares MSCI ACWI Low Carbon Target ETF (CRBN) | 0.2 | 807.7 | 6.16 | -21.69 | -20.55 | 4.81 |
iShares MSCI KLD 400 Social ETF (DSI) | 0.25 | 3537.5 | 7.26 | -22.01 | -20.1 | 9.68 |
iShares USD Green Bond ETF (BGRN) | 0.2 | 279.9 | -1.2 | -15.75 | -15.69 | -4.6 |
iShares® ESG MSCI EM Leaders ETF (LDEM) | 0.16 | 52 | -2.73 | -31.03 | -33.81 | |
BlackRock Liquid Environmentally Aware Inv A (LEAXX) | 0.45 | 1049.8 | 0.19 | 0.76 | 0.74 | 0.47 |
Vanguard Treasury Money Market Fund Investor (VUSXX) | 0.09 | 35412.7 | 0.24 | 0.88 | 0.88 | 0.55 |
Averages/Total* | 0.23 | 14412.8 | 3.00 | -17.50 | -17.47 | 1.62 |
S&P 500 Index | | | 8.1 | -17.7 | -14.61 | 10.22 |
MSCI USA Index | | | 7.94 | -18.85 | -16.49 | 10.13 |
MSCI USA Small Cap Index | | | 10.23 | -16.4 | -17.51 | 7.17 |
MSCI EAFE Index (Net) | | | 5.38 | -23.17 | -23 | -1.27 |
MSCI ACWI Index (Net) | | | 6.03 | -21.14 | -19.96 | 15.27 |
MSCI Emerging Markets Index (Net) | | | -3.1 | -29.42 | -31.03 | -4.42 |
Bloomberg U.S. Treasury Bill (1-3 M) | | | 0.22 | 0.85 | 0.86 | 0.56 |
Bloomberg U.S. Aggregate Bond Index | | | -1.3 | -15.72 | -15.68 | -3.77 |
Bloomberg U.S. Corporate High Yield Index | | | 2.6 | -12.53 | -11.76 | 0.31 |
S&P Green U.S. Dollar Select Index | | | -1.03 | -15.2 | -15.28 | -3.43 |
Averages** | | | 3.00 | -16.84 | -16.65 | 2.28 |
Notes of Explanation: Assets=Net Assets in millions. Blank cells=fund was not in operation during entire interval. *Average returns exclude the Vanguard Treasury Money Market Fund Investor. **Average returns exclude the S&P 500 Index to avoid double counting. Sources: Morningstar Direct and MSCI.
¹ To avoid duplications, these average results exclude Vanguard Treasury Money Market Fund and S&P 500 Index. ² A tenth fund, the Vanguard Treasury Money Market Fund, is an alternative money market fund. ³ iShares ESG MSCI EM Leaders Fund not in operation for the full 3-year time period to October 30, 2022.
Stocks gained 8.1% in October, but bonds dropped 1.3% on higher rates
The Bottom Line: The outperformance of selected ESG indices continue to narrow and long-term results are expected to converge and align with their conventional counterparts. Stocks bounced back in October with a gain of 8.1% while bonds gave up 1.3% as interest rates rose
Share This Article:
The Bottom Line: The outperformance of selected ESG indices continue to narrow and long-term results are expected to converge and align with their conventional counterparts.
Stocks bounced back in October with a gain of 8.1% while bonds gave up 1.3% as interest rates rose
Stocks bounced back in October, benefiting from corporate earnings reports that exceeded already lowered analyst expectations as well as economic news that came in better than expected. Across large cap, mid cap and small cap stocks, corresponding S&P indices gained 8.1%, 10.53% and 12.37%, respectively. The S&P 500 ESG Index increased by 8.87% versus 8.1% for the conventional index while the MSCI USA ESG Leaders Index added 7.30% and its conventional counterpart posted a gain of 7.94%. Only two of six selected ESG indices outperformed their conventional counterparts in October. Even with strong gains in October, results over the trailing 12-months still reflected steep declines for the S&P 500, S&P MidCap 400 and the S&P SmallCap 600 of 14.61%, 11.81% and 16.67%, in that order.
The S&P 500 Index was off to a strong start, gaining 5.7% during the first two days of October following the release of economic data that gave investors hope regarding a future rate easing on the part of the Federal Reserve. The gains were surrendered over the next six trading days, but the index managed to back track over the course of the remaining thirteen trading days with a gain of 8.2%. Ten of the 11 sectors that comprise the S&P indices posted positive results, except for the large cap Communications Sector. Energy Sector results dominated the three indices, with returns ranging from 22.15% to 28.11% for small cap energy stocks.
Stock gains contrasted sharply with the performance of bonds that repeated their negative performance in October. Intermediate investment-grade bonds, as measured by the Bloomberg US Aggregate Bond Index, dropped 1.3% as yields rose on 10-year Treasuries by 27 bps from 3.83% to 4.10% . Absolute returns in most segments of the bond market were negative. As has been the case all year, shorter-term holdings were the best relative performers. High yield corporate bonds and similar lower-rated bonds outperformed high quality instruments.
Markets overseas trailed the U.S. The MSCI ACWI ex USA Index gained 2.99% and MSCI EAFE rose 5.38%. Largely due to China and Taiwan that dropped 14.76% and 5.05%, respectively, emerging markets gave up another 3.10% after last month’s 11.7% decline.
Chart 1: S&P 500 Index cumulative price only rates of return-October 2022 Source: Yahoo Finance
Sustainable mutual funds and ETFs recorded a positive average return of 3.96%, bouncing back from last month’s average -7.8% decline
The universe of sustainable mutual funds and ETFs as defined by Morningstar, a total of 1,316 funds/share classes as of October 30, 2022 with $295.8 billion in assets cross all asset classes, posted an average gain of 3.96% in October and -19.4% for the trailing 12-months.
Equity funds, including domestic, international, and foreign funds, gained an average 5.81% while bond funds dropped 0.45%. Performance results ranged from a low of -17.58% recorded by the $3.6 million KraneShares MSCI China ESG Leaders ETF (KESG) to a high of 13.29% posted by the DFA US Sustainability Targeted Value Institutional Fund (DAABX) with its 41% exposure to small cap value stocks. Even with an outstanding one-month return, the fund remains in negative territory for the trailing 12-month period. Its 5.18% negative results, however, pale in comparison to the -51.34% recorded by KESG.
Top performing funds in October were dominated by small cap equity portfolios with an average blended and value orientation while the worst performing funds were exposed to emerging markets, including China.
Table 1a: Top 10 performing funds Table 1b: Bottom 10 performing funds
Fund Name
1-M TR
(%)
12-M TR (%)
Fund Name
1-M TR (%)
12-M TR (%)
DFA US Sustainability Targeted Val Instl
13.29
-5.18
Goldman Sachs ESG Em Mkts Eq Inst
-4.72
-39.66
Boston Trust Walden Small Cap
12.66
-5.92
Goldman Sachs ESG Emerging Mkts Eq C
-4.73
-40.29
Xtrackers S&P SmallCap 600 ESG ETF
12.41
-10.29
Goldman Sachs ESG Emerging Mkts Eq A
-4.74
-39.89
SPDR S&P SmallCap 600 ESG ETF
12.4
Goldman Sachs ESG Emerging Mkts Eq R
-4.77
-40.03
Columbia US ESG Equity Income ETF
12.32
1.22
Eventide Exponential Technologies A
-8.76
-40.23
iShares® ESG Screened S&P Small-Cap ETF
12.23
-12.47
Eventide Exponential Technologies N
-8.77
-40.29
Emerge EMPWR Sustainable Div Eq ETF
12.06
Eventide Exponential Technologies C
-8.82
-40.75
Praxis Small Cap Index I
11.99
-15.21
Martin Currie International Sust Eq IS
-11.36
-35.47
Praxis Small Cap Index A
11.98
-15.75
KraneShares MSCI China Clean Tech ETF
-14.12
-49.89
Fidelity® Water Sustainability
11.72
-18.04
KraneShares MSCI China ESG Leaders ETF
-17.58
-51.34
Notes of Explanation: Performance covering both mutual funds and ETFs=total returns in percentage terms for periods ending October 30, 2022. 1-M=1 month, 12-M=12 months. Blank cells=fund was not in operation during entire interval. Source: Morningstar Direct.
The outperformance of selected ESG screened indices continue to narrow in October
Four of six selected MSCI ESG Leaders indices lagged behind their conventional counterparts in October. These selected benchmarks consist of three international and foreign equity indices, two US stock indices and one fixed income index, all of which are comprised of companies with high ESG scores relative to sector peers. This is the fourth month in a row during which four or more of the same six indices trailed, and the seventh month so far in 2022.
For the trailing 1-year interval, five of the six benchmarks underperformed relative to their conventional counterparts. The exception is the MSCI Small Cap ESG Leaders Index that led by 1.99%.
All but the Bloomberg MSCI ESG Focus Aggregate Bond Index now underperform their conventional counterparts over the trailing 3-year time horizon. While some pockets of outperformance persist, for the five- and ten-year intervals the margins of outperformance have narrowed in 2022 through October 31st.
The outperformance of selected ESG screened indices is narrowing and long-term results are expected to converge and align with their conventional counterparts.
Chart 2: Selected sustainable indices intermediate and long-term relative total return performance results to October 30, 2022 Notes of Explanation: The six MSCI ESG indices include the MSCI USA ESG Leaders Index consisting of large and mid-cap companies, MSCI USA Small Cap ESG Leaders Index, MSCI ACWI, ex USA, Leaders Index consisting of large and mid-cap companies in developed and developing countries, MSCI EAFE ESG Leaders Index consisting of large and mid-cap companies in developed markets. MSCI Leaders indices are constructed to provide exposure to companies with high ESG scores relative to their sector peers. Intermediate term covers 3 and 5 years. Long-term=10 years. Source: MSCI
SRA Select List of funds posted an average gain of 3.0% in October, partly reversing last month’s decline of 6.84%
SRA Select funds posted an average increase of 3.0% in October, equivalent to the 3% average increase registered by their corresponding conventional benchmarks¹. Excluding money market funds, returns ranged from low of -2.73% recorded by the iShares ESG MSCI EM Leaders ETF (LDEM) to a high of 10.09% posted by the iShares ESG Aware MSCI USA Small-Cap ETF (ESML). Refer to Table 2 for a complete rundown of SRA Select list of mutual funds and ETFs and their performance results over several time periods to October 30th.
Consisting of nine funds² pursuing discrete investment strategies intend for use as building blocks in the creation of a diversified ESG-oriented portfolio, seven of the nine funds underperformed their conventional benchmarks in October. Eight of the nine funds trailed for the 12-month interval while six of eight funds underperformed over the trailing three-years³. In both cases, the 12-month and three-year outcomes were the same last month. (Refer to previously published article SRA Select Listing: ESG Integration Investment Fund Q1-2022 https://sustainableinvest.com/sra-select-listing-esg-integration-investment-funds-q1-2022/).
Table 2: Performance of SRA Select listed mutual funds and ETFs-October 2022
Fund name/Index
Expense Ratio (%)
Assets
($ M)
1-Month Total Return (%)
Y-T-D Total Return (%)
12-M Total Return (%)
3-Year
TR
(%)
iShares ESG Advanced Hi Yld Corp Bd ETF (HYXF)
0.35
130
2.85
-12.75
-12.03
-1.12
iShares ESG Aware MSCI EAFE ETF (ESGD)
0.2
6102.4
5.68
-23.82
-23.82
-1.24
iShares ESG Aware MSCI USA Small-Cap ETF (ESML)
0.17
1462.1
10.09
-15.5
-16.19
8.83
iShares ESG U.S. Aggregate Bond ETF (EAGG)
0.1
2040.9
-1.29
-15.73
-15.78
-3.88
iShares MSCI ACWI Low Carbon Target ETF (CRBN)
0.2
807.7
6.16
-21.69
-20.55
4.81
iShares MSCI KLD 400 Social ETF (DSI)
0.25
3537.5
7.26
-22.01
-20.1
9.68
iShares USD Green Bond ETF (BGRN)
0.2
279.9
-1.2
-15.75
-15.69
-4.6
iShares® ESG MSCI EM Leaders ETF (LDEM)
0.16
52
-2.73
-31.03
-33.81
BlackRock Liquid Environmentally Aware Inv A (LEAXX)
0.45
1049.8
0.19
0.76
0.74
0.47
Vanguard Treasury Money Market Fund Investor (VUSXX)
0.09
35412.7
0.24
0.88
0.88
0.55
Averages/Total*
0.23
14412.8
3.00
-17.50
-17.47
1.62
S&P 500 Index
8.1
-17.7
-14.61
10.22
MSCI USA Index
7.94
-18.85
-16.49
10.13
MSCI USA Small Cap Index
10.23
-16.4
-17.51
7.17
MSCI EAFE Index (Net)
5.38
-23.17
-23
-1.27
MSCI ACWI Index (Net)
6.03
-21.14
-19.96
15.27
MSCI Emerging Markets Index (Net)
-3.1
-29.42
-31.03
-4.42
Bloomberg U.S. Treasury Bill (1-3 M)
0.22
0.85
0.86
0.56
Bloomberg U.S. Aggregate Bond Index
-1.3
-15.72
-15.68
-3.77
Bloomberg U.S. Corporate High Yield Index
2.6
-12.53
-11.76
0.31
S&P Green U.S. Dollar Select Index
-1.03
-15.2
-15.28
-3.43
Averages**
3.00
-16.84
-16.65
2.28
Notes of Explanation: Assets=Net Assets in millions. Blank cells=fund was not in operation during entire interval. *Average returns exclude the Vanguard Treasury Money Market Fund Investor. **Average returns exclude the S&P 500 Index to avoid double counting. Sources: Morningstar Direct and MSCI.
¹ To avoid duplications, these average results exclude Vanguard Treasury Money Market Fund and S&P 500 Index. ² A tenth fund, the Vanguard Treasury Money Market Fund, is an alternative money market fund. ³ iShares ESG MSCI EM Leaders Fund not in operation for the full 3-year time period to October 30, 2022.
Sustainableinvest.com
Benefits
Free access to regularly updated original research and analysis focused exclusively on sustainable finance and investing, providing investors with the guidance needed to make informed investment decisions that align with their personal values and financial goals while also contributing to the advancement of positive long-term environmental and social outcomes.
By offering financial support for our current work, either in the form of a one-time or regular contributions, you help to defray some of the costs associated with conducting our research and analysis as well as to maintain the www.sustainableinvest.com website.
Helping us to expand our research capabilities and offerings over time to cover additional relevant topics geared to sustainable investors.
Sign up to free newsletters.
By submitting this form, you are consenting to receive marketing emails from: . You can revoke your consent to receive emails at any time by using the SafeUnsubscribe® link, found at the bottom of every email. Emails are serviced by Constant Contact