Major US stock market indexes recorded their best four-month start to a year since at least 1999, the latest milestone fueled by a more accommodative Federal Reserve Bank and upbeat economic prospects that reversed a sharp downturn in December of last year. The S&P 500 posted a gain of 4.05% in April, the fourth consecutive monthly increase this year that pushed year-to-date results to 21.29% and 24.07% over the previous 12-months. The Dow Jones Industrial Average, up 14% since the start of the year, also registered its best four-month start since 1999. The Nasdaq Composite’s 22% advance is its best start since 1991. Large cap value stocks outperformed growth stocks by 14 basis points (bps), but the relationship is a short-lived one as large cap growth stocks exceed the performance of value stocks at least for the cumulative ten-year interval through April. At the same time, small cap stocks trailed large caps. Outside the US, stocks posted positive but slightly weaker results. Europe, as measured by the MSCI EAFE Index was up 3.58% while the broader MSCI ACWI, ex US was up 2.64% and Latin America gained 1.05%. Investment-grade intermediate bonds recorded a very slight gain of 0.03%, much below last month’s 1.92% increase, as 10-year US Treasuries ended the month with a yield of 2.51%, up 10 bps from 2.41% at the end of March.
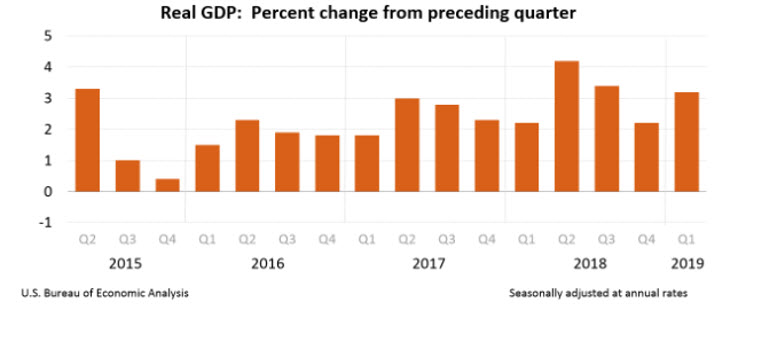
Investor sentiment was influenced by expectations regarding US-China trade negotiations, the US economy and positive corporate earnings expectations. Strength in the US economy was reinforced at the end of the month when the Bureau of Economic Analysis on April 26 released an “advance” estimate of real gross domestic product (GDP). According to the report, GDP increased at an annual rate of 3.2% in the first quarter of 2019 versus an increase of 2.2% in the fourth quarter of 2018. While still based on incomplete source data subject to further revisions that will be released at the end of May, the increase in real GDP in the first quarter reflected positive contributions from personal consumption expenditures (PCE), private inventory investment, exports, state and local government spending, and nonresidential fixed investment. Imports, which are a subtraction in the calculation of GDP, decreased. These contributions were partly offset by a decrease in residential investment.
The US was not alone. The eurozone, consisting of 19 monetary union member countries, experienced an economic expansion of 0.4% in the first quarter relative to the previous three-month period. According to Eurostat, the European Union’s statistics agency, this represented a doubling of the rate experienced in the last quarter of 2018. At the same time, Eurostat said the eurozone’s unemployment rate has fallen to 7.7%, its lowest level since Sept. 2008. China’s economy, on the other hand, grew by 1.4% quarter-on-quarter in the three months to March 2019, compared to a 1.5% expansion in the previous period. It was the weakest quarterly growth rate since the first quarter of 2016. GDP Growth Rate in China averaged 1.78 percent from 2010 until 2019, reaching an all-time high of 2.40 percent in the first quarter of 2011 and a record low of 1.40 percent in the first quarter of 2016.
Turning to corporate earnings, according to FactSet, earnings reports have mostly exceeded expectations with 76% of companies having reported results beating analysts forecasts through the end of April. The better than expected earnings have put the S&P 500 on pace to report a smaller than expected contraction in profit growth for the first quarter. Growth is now set to contract 1.6% from a year earlier, less than the roughly 4% analysts initially expected in early April, and more than 200 companies in the broad index are still due to report results.
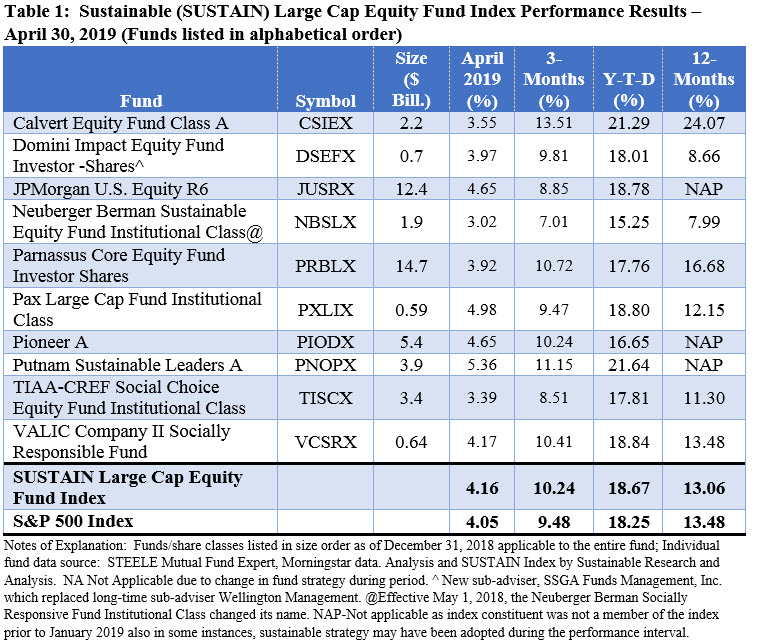
Sustainable (SUSTAIN) Large Cap Equity Fund Index posts return of 4.16% and beats S&P 500
The Sustainable (SUSTAIN) Large Cap Equity Fund Index, which now leads the S&P 500 since the start of the year, extended the streak of outperformance relative to the S&P 500 to three months, posting a total return of 4.16% versus 4.05% registered by the conventional S&P 500 counterpart. Still, only four of the ten funds that make up the index managed to outperform the S&P 500 with recorded gains ranging from 4.17% to 5.36%. The highest return in April was recorded by the Putnam Sustainable Leaders Fund A, up 5.36%. This $4.7 billion fund that was renamed and repurposed its strategy by formally adopting ESG integration language in its prospectus in 2018, also leads since the start of the year with a total return of 23.48%. The fund benefited from its Technology sector exposure which stood at 36.68% versus 23.50% for the S&P 500 while lessening the impact of the negative performing Energy (-0.01%) and Real Estate (-0.57%) sectors in April by avoiding these sectors altogether. While the fund likely did not benefit from its 16.34% non-US stock exposure or the 3.55% cash position maintained as of March 31st, the investment vehicle was buoyed by the performance of some of its largest holdings, including Microsoft Corp. (MSFT), up 10.7% in April, Adobe Inc. (ADBE), up 8.5%, and Amazon.com Inc. (AMZN), up 8.2%. Together, these stocks accounted for a combined weight of 13.5% as of March 31.
The second best performing SUSTAIN Index member was is the Pax Large Cap Fund Institutional Class. Ranked in the second position for the first time so far this year, this $684.1 million fund sourcing largely institutional investors employs an ESG integration strategy along with some exclusions (refer to Fund Directory tab for additional details). This growth oriented investment fund, which maintained a limited 2.2% position in cash, appears to have benefited from stock selection rather than its growth orientation or sector allocation. In fact, the fund’s 17.99% allocation to Healthcare likely detracted from performance relative to the S&P 500 given the sector’s -2.74% return for the month while the portfolio’s underweighting in Industrials didn’t benefit as much from the sector’s 4.05% gain. On the other hand, the Pax Large Cap Fund benefited from the performance of its top 5 holdings that accounted for almost 20% of the portfolio as of year-end 2018. Its exposures to Microsoft Corp. (MSFT), Amazon.com Inc. (AMZN), Apple Inc. (AAPL), Ingersoll-Rand (IR) and JP Morgan Chase & Co. (JPM), the fund’s top 5 holdings, added an average 10.7% in April, with individual firm results adding from 5.6% for AAPL to 15.5% for JPM.
Bringing up the rear for the second consecutive month is the Neuberger Berman Sustainable Equity Fund Institutional Class. The $2.0 billion fund which also settled into the last position over the trailing 3-month, year-to-date and 12-month intervals, posted a gain of 3.02% but lagged behind the S&P 500 by 1.03%. The fund employs an ESG integration strategy that’s combined with shareholder engagement. Its 13.25% allocation to UK and greater European stocks likely detracted from April’s performance since European stocks as measured by the S&P Europe 350 lagged the S&P 500 with a gain of 3.82%. Similarly, the portfolio’s 14.34% allocation to technology stocks versus 23.50% for the S&P 500 held back the fund’s performance in a month when the technology sector delivered strong results. Absent from the fund’s top holdings were names such as Microsoft, Amazon and to a lesser degree, Apple, Inc. Refer to Table 1 and Chart 2.
SUSTAIN Large Cap Equity Fund Index Cumulative Performance Results: December 31, 2016 – April 30, 2019
Chart 2:
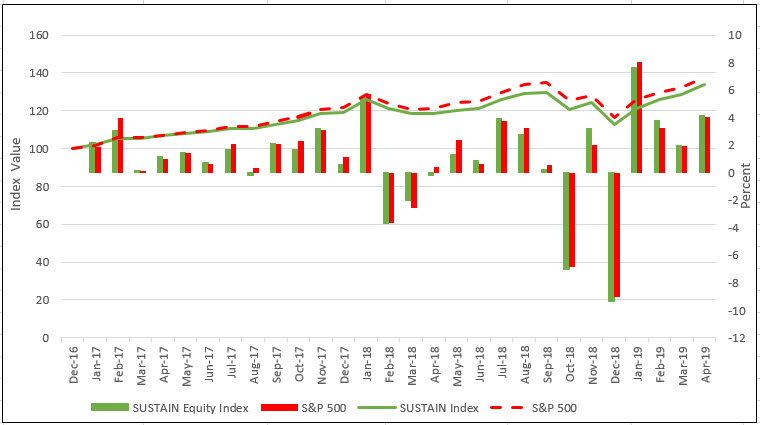
Notes of Explanation: December 31, 2016 =100. Data source: STEELE Mutual Fund Expert, Morningstar data. Analysis and SUSTAIN Index by Sustainable Research and Analysis.
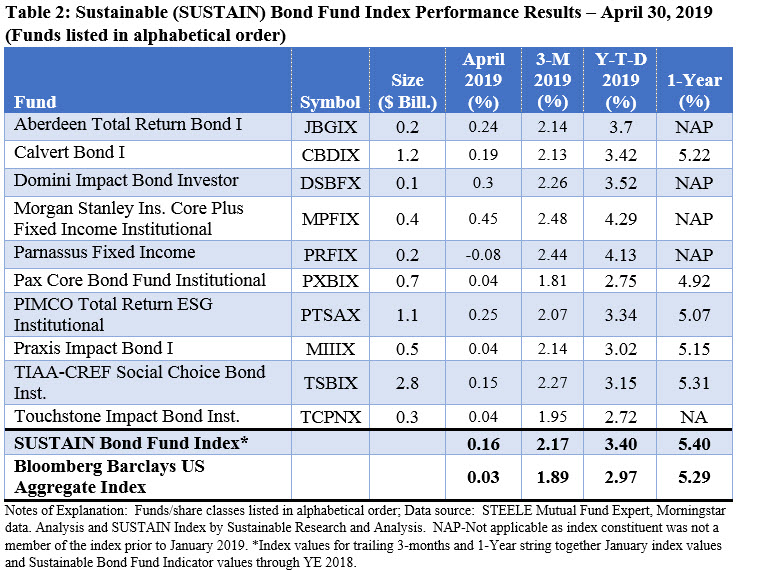
Sustainable (SUSTAIN) Bond Fund Index, up 0.16%, outperforms Bloomberg Barclays US Aggregate Index that also eked out a positive 0.03% gain
After posting a strong increase of 1.85% last month but still lagging the conventional Bloomberg Barclays US Aggregate Bond Index by a slight 0.07%, the SUSTAIN Bond Fund Index ended April with a narrower gain of 0.16%. Still, this was enough to eclipse the conventional Bloomberg Barclays counterpart by 13 basis points. Nine constituent funds posted positive results in April while the same nine funds generated results that were equal to or exceeded the total return recorded by the conventional Bloomberg benchmark which was up 0.03%. The SUSTAIN Bond Fund Index is ahead of the Bloomberg Barclays US Aggregate Index for the latest three-month, year-to-date and trailing twelve month intervals.
The best performing SUSTAIN Index fund member in April is the $410.2 Morgan Stanley Institutional Core Plus Fixed Income Institutional Fund that in June 2018 adopted ESG integration language in its prospectus while also indicating that it may engage with management of certain issuers regarding corporate governance practices as materially important environmental and/or social issues facing a company. The fund, which recorded a one-month gain of 0.45% and a strong 4.29% increase since the start of the year, likely benefited from its exposure to lower investment-grade as well as non-investment-grade credits versus the benchmark. As of March 31, 2019, the fund’s investments in BBB rated securities and below, including non-rated securities accounted for 48.3% of portfolio assets as compared to 14.5% in BBB rated securities for the benchmark. At the same time, the fund’s average effective duration was roughly in line with the Bloomberg Index at 5.77 versus 5.59.
At the other end of the range, the Parnassus Fixed Income Fund, a $213.2 million fund that incorporates ESG factors and also employs exclusions, impact and engagement strategies, was the only fund to post a negative return for the month. Its -0.08% return was hampered by its longer average effective duration of 6.48 and higher average credit quality derived from having 70.1% of portfolio assets invested in credits rated A or higher during a month when lower rated bonds were stronger performers while longer dated bonds were weaker performers. Refer to Table 2 and Chart 3.
SUSTAIN Bond Fund Index Cumulative Performance Results – December 31, 2017 – April 30, 2019
Chart 3:
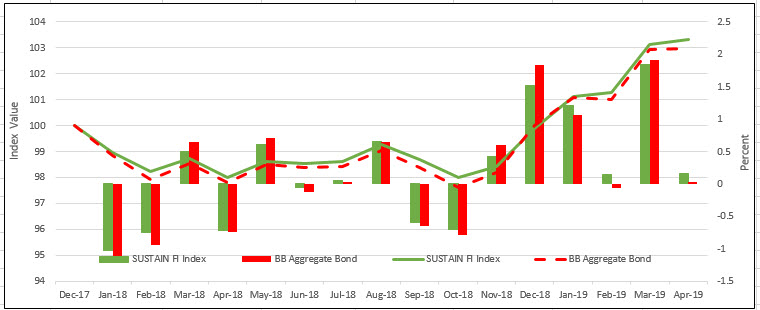
Notes of Explanation: December 31, 2017 =100. Data source: STEELE Mutual Fund Expert, Morningstar data. Analysis and SUSTAIN Indicator by Sustainable Research and Analysis. *Index values for trailing 3-months and 1-Year string together January-February index values and Sustainable Bond Fund Indicator values through YE 2018.
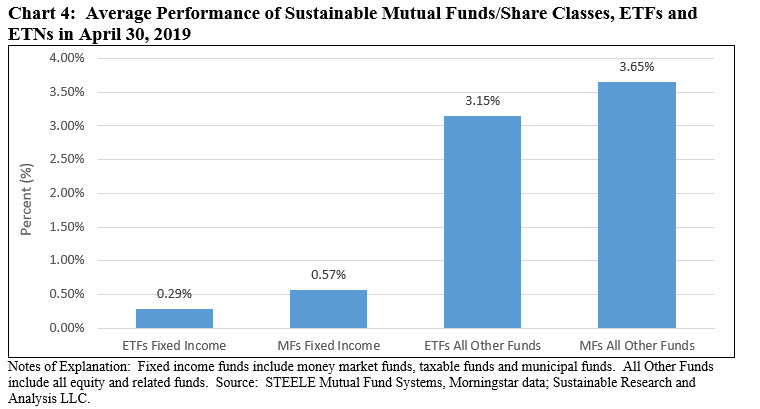
Universe of sustainable mutual funds and ETFs up an average 2.58% in April
Looking across the entire universe of 2,067 sustainable mutual funds/share classes, exchange-traded funds (ETFs) and exchange-traded notes (ETNs), consisting of funds that posted total return performance results for the entire month of April, these investment vehicles recorded an average gain of 2.58%. Only 88 funds, or 4.3%, produced negative returns.
Drilling down, results for mutual funds/share classes and ETFs/ETNs vary by asset class, ranging from an average 0.29% posted by fixed income ETFs to a high of 3.65% produced by all other mutual funds, including domestic and global mutual funds and their corresponding share classes as well as all related funds. Refer to Chart 4.
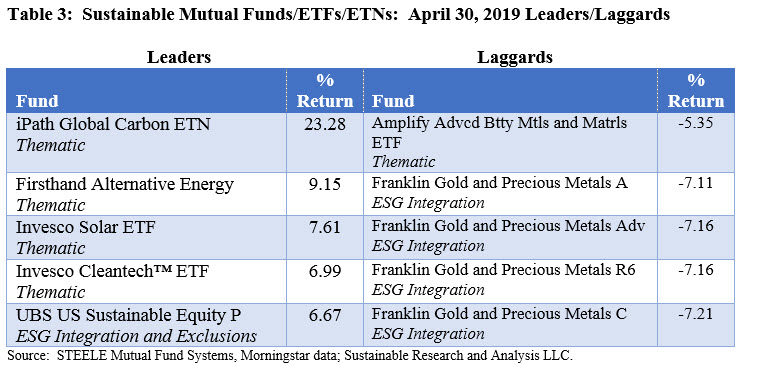
Best performing ESG fund up 23.28% in April while the worst performing fund gave up -7.16%
Based on the universe of 2,067 mutual funds/share classes, exchange-traded funds (ETFs) and exchange-traded notes (ETNs) posting total returns across the entire month of April, the best performing sustainable fund is the iPath Global Carbon ETN, a thematic fund that seeks to replicate the investment performance results of the Barclays Global Carbon II TR USD Index and to provide exposure to the global price of carbon. To achieve this, the Index references the price of carbon emissions credits from the world’s major emissions related mechanisms. These mechanisms currently included in the index are the European Union Emission Trading Scheme and the Kyoto Protocol’s Clean Development Mechanism.
At the other end of the range, the Franklin Gold and Precious Metals Advantage Fund, which employs an ESG integration strategy, was the worst performing fund in April, recording a decline of -7.11%. Effective November 28, 2018, the fund’s registration statement was amended to reflect the fact that the investment manager’s process “generally includes an assessment of the potential impacts of any material environmental, social and governance (ESG) factors on the long-term risk and return profile of a company.” Refer to Table 3.