Stock market registers -1.58% decline in volatile month while bonds blew the lights out and sustainable indices, for the most part, outperformed conventional benchmarks
A volatile August ended the last week of the month as it began but with opposite outcomes, driven by trade tensions between the US and China, geopolitical uncertainties and signs of an economic slowdown in the US and overseas. By month-end, the broad market as measured by the S&P 500 closed down -1.58% while the Dow Jones Industrial Average gave up -1.32% and the Nasdaq Composite dropped -2.46%. Refer to Chart 1. Small company stocks ended even lower, giving up -4.94% as measured by the Russell 2000 Index. Growth stocks outperformed value stocks while large caps eclipsed their small cap counterparts. Foreign markets also ended lower while at the same time, bonds generally, and long-dated bonds in particular, blew out the lights in August. Long dated Treasury and US government indices gained over 10% and the intermediate-term Bloomberg Barclays US Aggregate Bond Index added 2.59%. For the most part, sustainable equity, foreign, emerging market stock, bonds as well as fund indices outperformed conventional indices.
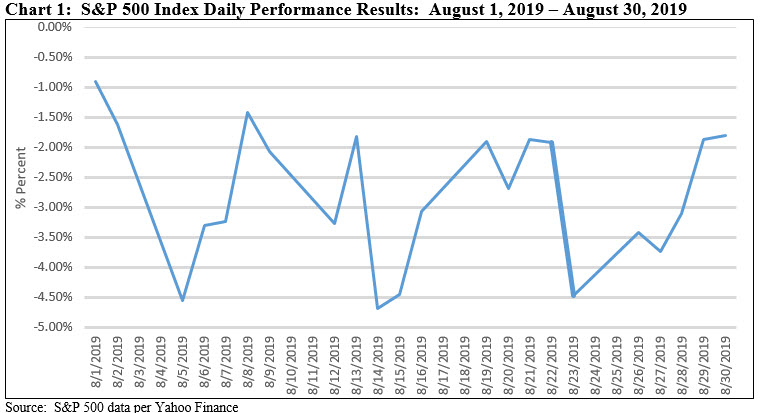
After reaching a high of 3025.86 on Friday July 26, the S&P 500 registered five successive declines to end the first week in August down -3.10%–the worst week in 2019. Concerns regarding the preservation of economic growth in the light of global developments as well as muted inflation pressures that led to a lowering the previous Wednesday of the target range for the federal funds interest rate to 2% to 2-1/4% were exacerbated by President Trump’s surprise announcement the next day that 10% tariffs applicable to an additional $300 billion of Chinese imports would take effect September 1st of this year. This led to one of the most volatile days on Wall Street since last winter’s selloff and all major indexes were dragged down for the day and the week. The Nasdaq Composite declined -3.92% while the Dow Jones Industrial Average posted more limited -2.6% decline.
Turbulent trading characterized the rest of the month with the S&P 500 rising or falling in 11 of 23 sessions by more than 1% as fears regarding the trade conflict and the economy ebbed and flowed. The S&P 500 dipped as low as -4.69% by mid-August. There were a series of surprising interest rate cuts announced by the central banks of India, Thailand and New Zealand that signaled to investors growing concerns about the outlook for economic growth while in the US, a widely followed leading recession indicator, the relationship between 90-day and 10-year Treasury yields, which has been consistently inverted since May of this year, drew renewed attention when the yields on 10-year Treasuries briefly fell below two-year Treasury yields. Still, strong retail sales data released mid-month by the Commerce Department and the National Retail Federation showed that retail sales were up in July. This seemed to overcome lower industrial output and growth data reported by Germany and China.
The S&P 500 managed to stage a partial recovery until August 23rd when exchanges between China and the US regarding trade escalated to new unprecedented levels. It started when China announced new tariffs and a resumption of penalties on US cars. In response, US companies were ordered by President Trump to immediately start seeking alternatives to China. Even as the import of the irregular admonition by a US President was less than clear, markets were rattled. These developments unfolded on top of mixed economic reports released earlier that week. The Labor Department lowered its estimate of total US employment by as much as half a million jobs for the period covering 2018 through the first quarter of 2019 while other government data has been revising down estimates of growth and corporate profits. Also, the Congressional Budget Office reported that the Federal budget deficit was growing at a faster pace than expected, to $1 trillion for the fiscal year 2020. On the other hand, sales of previously owned homes posted a gain in July while several retailers weighed in with strong quarterly earnings results—thereby bolstering the view that consumers in the US remain confident about the economy. Adding support, Federal Reserve Chairman Powell on Friday in his much anticipated prepared remarks from the Jackson Hole Summit meeting made it known that the Fed will “act as appropriate to sustain the expansion.”
Outside the US, markets ended even lower. The MSCI ACWI ex USA (Net) posted a decline of -3.09% while emerging market equities closed even lower at -4.88% as measure by the MSCI Emerging Markets Index.
Sustainable (SUSTAIN) Large Cap Equity Fund Index Beats S&P 500 by 35 Basis Points
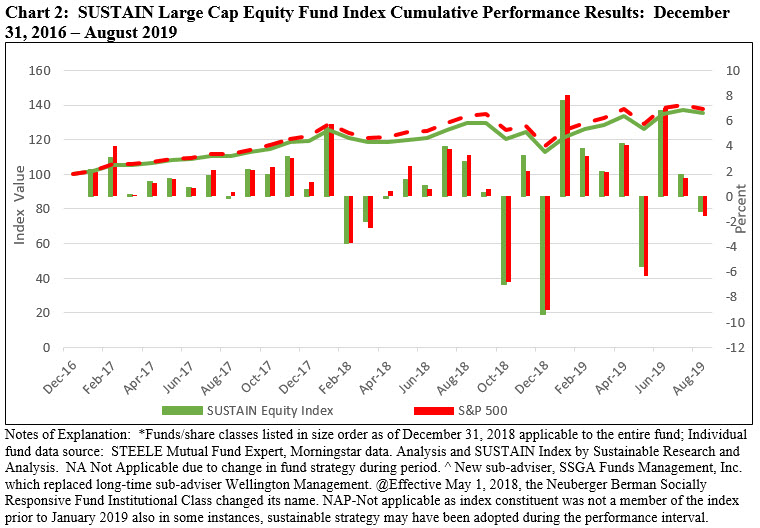
While down -1.23% in August, the SUSTAIN Large Cap Equity Fund Index nevertheless beat the S&P 500 by 35 basis points (bps), marking the sixth time during the last eight months that the SUSTAIN Index outperformed the conventional equity benchmark. The SUSTAIN Large Cap Equity Fund Index is also ahead of the S&P 500 over the previous 3-months, year-to-date and 12-month intervals, leading with total returns of 7.33%, 20.27% and 4.89%, respectively. Refer to Chart 2.
Seven funds outperformed the S&P 500 in August, but only one fund delivered positive results. With a total return of 2.19%, Calvert Equity A led by a substantial margin relative to the S&P 500 but also as compared to the other nine fund index members. The best of these, the Parnassus Core Equity Investor followed by the JPMorgan US Equity R6, posted a drop of -0.08% and -1.49%, respectively. Refer to Table 1.
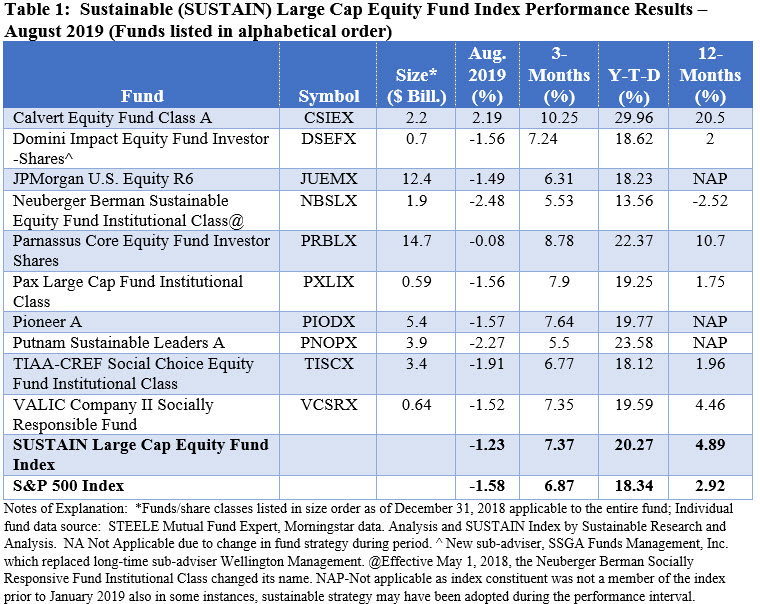
The $3.2 billion Calvert Equity A not only led all SUSTAIN index members in August but the fund excels over the 3-month, year-to-date and 12-month intervals. Fund assets, which include cash in the amount of 3.52% as of June 30th, are deployed across nine of 11 sectors. 0.0% of assets were allocated to Energy and Utilities while the highest concentration of assets, accounting for 56.65% of assets are distributed across Technology, 22.66%, Financial Services, 17.03%, and Health Care, 16.96%. The fund’s top holdings, each in excess of 4% and below 5%, include Visa Inc., Danaher Corp., Microsoft Corp., Thermo Fisher Scientific Inc. and Alphabet Inc. Class C. Together, these holdings make up almost 24% of the portfolio.
Sustainable (SUSTAIN) Bond Fund Index Posts 2.58% Return but Lags Bloomberg Barclays US Aggregate Index by 0.009%
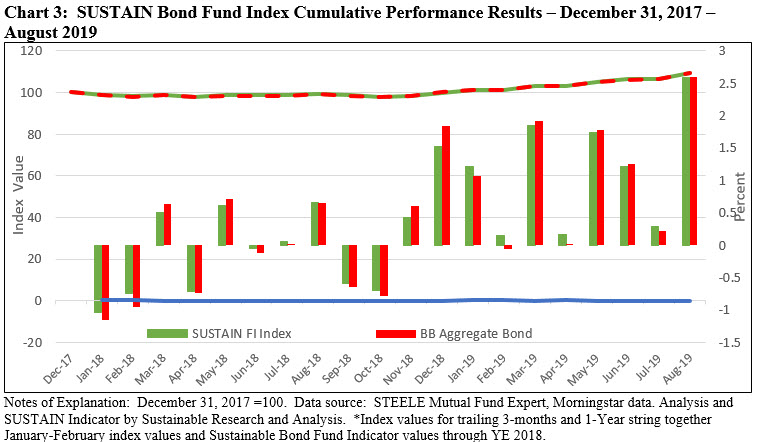
The SUSTAIN Bond Fund Index recorded a gain of 2.58% in August, the best monthly total return result since commencement of the index as of December 2017 and a full 4.16 over the performance of the S&P 500. Still, it fell 0.009% short of the conventional Bloomberg Barclays US Aggregate Index (BB), or less than one basis point. Five of the ten funds that comprise the SUSTAIN Bond Index generated results that were equal to or greater than the 2.59% posted by Bloomberg Barclays US Aggregate Index, led by PIMCO Total Return ESG Institutional Fund and followed by the Parnassus Fixed Income Fund that generated gains of 2.83% and 2.81%, respectively. Even the lagging Praxis Impact Bond Fund I that added 2.29% in August outperformed large cap equities. Refer to Table 2 and Chart 3.
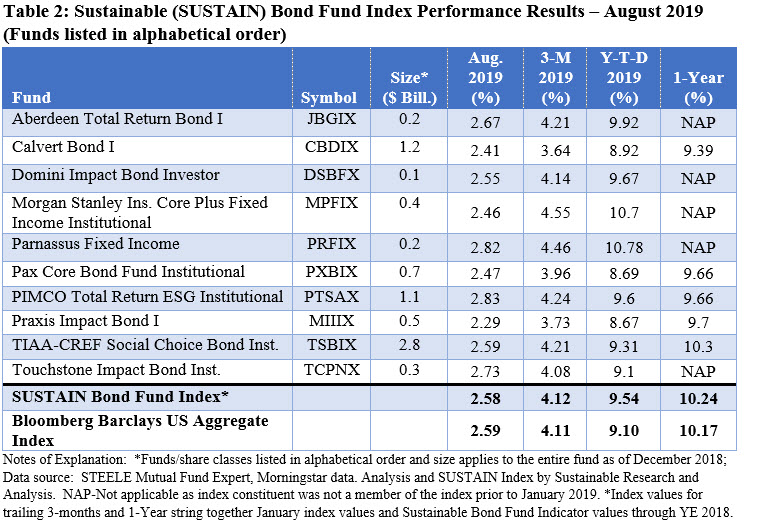
The leading funds in August achieved their results via different portfolio strategy paths. Whereas PIMCO maintained an effective maturity of 6.81 years, emphasized agency MBS and investment grade corporate credits and employed tactical currency positioning strategies, Parnassus emphasized investments in government securities and corporates with an average credit rating of A and maintained a longer-dated effective maturity of 8.23 years relative to peers. The strategy also succeeded in pushing Parnassus Fixed Income into the lead over the last 3-months and year-to-date intervals.
The SUSTAIN Bond Fund Index continues to exceed the performance of BB over the previous three-months, year-to-date, 12-month interval and since inception over which sustainable bond funds lead by 0.32%.
Sustainable (SUSTAIN) Foreign Equity Fund Index Eclipses MSCI ACWI, ex USA by 1.09%
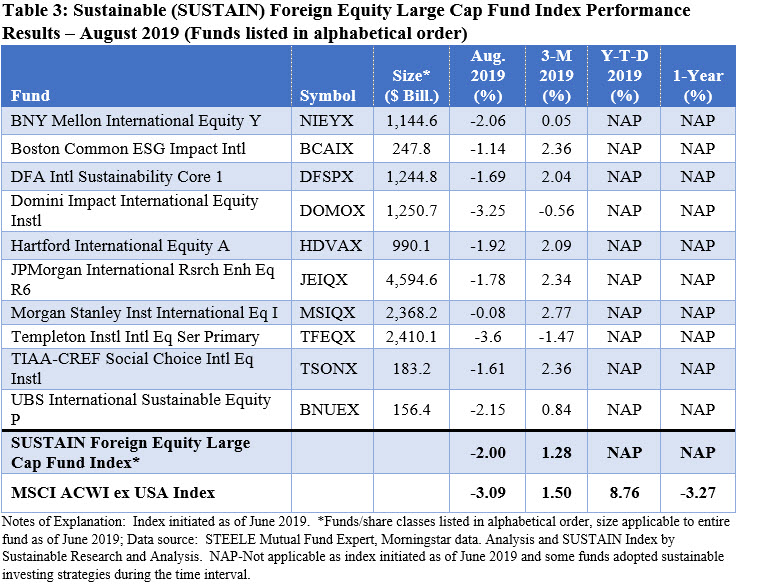
For the first time since calculation of the SUSTAIN Foreign Equity Fund Index started as of May 31, 2019 the total return results for August exceeded the performance of the conventional MSCI ACWI ex USA (NR). The SUSTAIN Foreign Equity Fund Index posted a negative -2.00% return for a positive differential of 1.09% as eight of the ten constituent funds outperformed the MSCI ACWI ex USA Index. The best performers in August were both large cap blend funds, including the $2.2 billion Morgan Stanley Institutional International Equity Fund I, -0.8%, and the much smaller $229.9 million Boston Common ESG Impact International Fund, down -1.14%. Refer to Table 3.
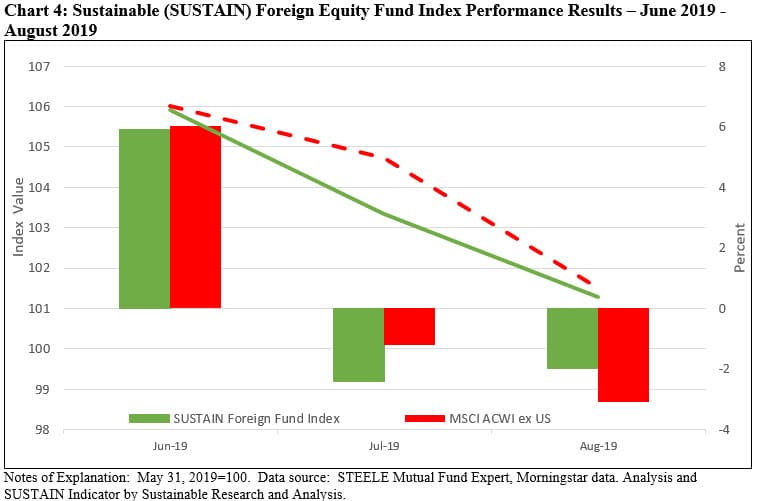
Over the trailing three months, the SUSTAIN Foreign Fund Index lags by 22 basis points. Refer to Chart 4.
Performance of ESG indices versus non-ESG indices: Clear wins in August for sustainable indices, including US, foreign and emerging market equities as well as US bonds
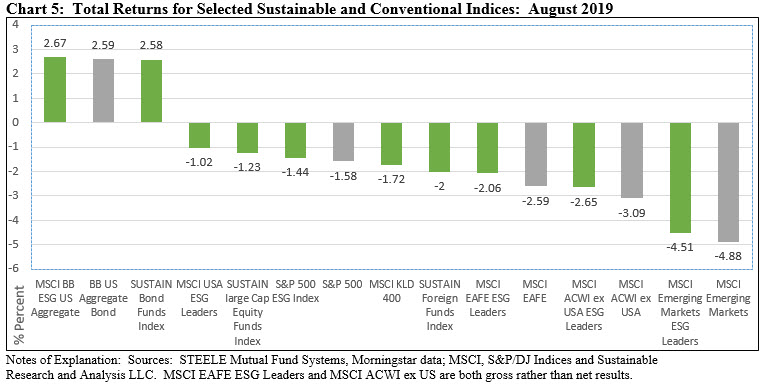
US Equities-Sustainable US equities and funds outperformed the conventional S&P 500 Index by a range from 14 bps to 56 bps. The one exception is the MSCI KLD 400 Index that lagged the S&P 500 Index by 14 bps.
Fixed Income-The MSCI Bloomberg ESG US Aggregate Index beat the conventional Bloomberg Barclays US Aggregate Index by 9 bps while sustainable bond funds fell behind by just 1 bps.
Foreign Equities-The MSCI EAFE ESG Leaders, MSCI ACWI ex US ESG Leaders and MSCI Emerging Markets ESG Leaders bested their conventional index counterparts. The SUSTAIN Foreign Equity Fund Index outperformed them all, ending the month down -2.00%.
Refer to Chart 5.
SUSTAIN Indices Post Competitive Returns: August 2019 Update
Stock market registers -1.58% decline in volatile month while bonds blew the lights out and sustainable indices, for the most part, outperformed conventional benchmarks A volatile August ended the last week of the month as it began but with opposite outcomes, driven by trade tensions between the US and China, geopolitical uncertainties and signs of…
Share This Article:
Stock market registers -1.58% decline in volatile month while bonds blew the lights out and sustainable indices, for the most part, outperformed conventional benchmarks
A volatile August ended the last week of the month as it began but with opposite outcomes, driven by trade tensions between the US and China, geopolitical uncertainties and signs of an economic slowdown in the US and overseas. By month-end, the broad market as measured by the S&P 500 closed down -1.58% while the Dow Jones Industrial Average gave up -1.32% and the Nasdaq Composite dropped -2.46%. Refer to Chart 1. Small company stocks ended even lower, giving up -4.94% as measured by the Russell 2000 Index. Growth stocks outperformed value stocks while large caps eclipsed their small cap counterparts. Foreign markets also ended lower while at the same time, bonds generally, and long-dated bonds in particular, blew out the lights in August. Long dated Treasury and US government indices gained over 10% and the intermediate-term Bloomberg Barclays US Aggregate Bond Index added 2.59%. For the most part, sustainable equity, foreign, emerging market stock, bonds as well as fund indices outperformed conventional indices.
After reaching a high of 3025.86 on Friday July 26, the S&P 500 registered five successive declines to end the first week in August down -3.10%–the worst week in 2019. Concerns regarding the preservation of economic growth in the light of global developments as well as muted inflation pressures that led to a lowering the previous Wednesday of the target range for the federal funds interest rate to 2% to 2-1/4% were exacerbated by President Trump’s surprise announcement the next day that 10% tariffs applicable to an additional $300 billion of Chinese imports would take effect September 1st of this year. This led to one of the most volatile days on Wall Street since last winter’s selloff and all major indexes were dragged down for the day and the week. The Nasdaq Composite declined -3.92% while the Dow Jones Industrial Average posted more limited -2.6% decline.
Turbulent trading characterized the rest of the month with the S&P 500 rising or falling in 11 of 23 sessions by more than 1% as fears regarding the trade conflict and the economy ebbed and flowed. The S&P 500 dipped as low as -4.69% by mid-August. There were a series of surprising interest rate cuts announced by the central banks of India, Thailand and New Zealand that signaled to investors growing concerns about the outlook for economic growth while in the US, a widely followed leading recession indicator, the relationship between 90-day and 10-year Treasury yields, which has been consistently inverted since May of this year, drew renewed attention when the yields on 10-year Treasuries briefly fell below two-year Treasury yields. Still, strong retail sales data released mid-month by the Commerce Department and the National Retail Federation showed that retail sales were up in July. This seemed to overcome lower industrial output and growth data reported by Germany and China.
The S&P 500 managed to stage a partial recovery until August 23rd when exchanges between China and the US regarding trade escalated to new unprecedented levels. It started when China announced new tariffs and a resumption of penalties on US cars. In response, US companies were ordered by President Trump to immediately start seeking alternatives to China. Even as the import of the irregular admonition by a US President was less than clear, markets were rattled. These developments unfolded on top of mixed economic reports released earlier that week. The Labor Department lowered its estimate of total US employment by as much as half a million jobs for the period covering 2018 through the first quarter of 2019 while other government data has been revising down estimates of growth and corporate profits. Also, the Congressional Budget Office reported that the Federal budget deficit was growing at a faster pace than expected, to $1 trillion for the fiscal year 2020. On the other hand, sales of previously owned homes posted a gain in July while several retailers weighed in with strong quarterly earnings results—thereby bolstering the view that consumers in the US remain confident about the economy. Adding support, Federal Reserve Chairman Powell on Friday in his much anticipated prepared remarks from the Jackson Hole Summit meeting made it known that the Fed will “act as appropriate to sustain the expansion.”
Outside the US, markets ended even lower. The MSCI ACWI ex USA (Net) posted a decline of -3.09% while emerging market equities closed even lower at -4.88% as measure by the MSCI Emerging Markets Index.
Sustainable (SUSTAIN) Large Cap Equity Fund Index Beats S&P 500 by 35 Basis Points
While down -1.23% in August, the SUSTAIN Large Cap Equity Fund Index nevertheless beat the S&P 500 by 35 basis points (bps), marking the sixth time during the last eight months that the SUSTAIN Index outperformed the conventional equity benchmark. The SUSTAIN Large Cap Equity Fund Index is also ahead of the S&P 500 over the previous 3-months, year-to-date and 12-month intervals, leading with total returns of 7.33%, 20.27% and 4.89%, respectively. Refer to Chart 2.
Seven funds outperformed the S&P 500 in August, but only one fund delivered positive results. With a total return of 2.19%, Calvert Equity A led by a substantial margin relative to the S&P 500 but also as compared to the other nine fund index members. The best of these, the Parnassus Core Equity Investor followed by the JPMorgan US Equity R6, posted a drop of -0.08% and -1.49%, respectively. Refer to Table 1.
The $3.2 billion Calvert Equity A not only led all SUSTAIN index members in August but the fund excels over the 3-month, year-to-date and 12-month intervals. Fund assets, which include cash in the amount of 3.52% as of June 30th, are deployed across nine of 11 sectors. 0.0% of assets were allocated to Energy and Utilities while the highest concentration of assets, accounting for 56.65% of assets are distributed across Technology, 22.66%, Financial Services, 17.03%, and Health Care, 16.96%. The fund’s top holdings, each in excess of 4% and below 5%, include Visa Inc., Danaher Corp., Microsoft Corp., Thermo Fisher Scientific Inc. and Alphabet Inc. Class C. Together, these holdings make up almost 24% of the portfolio.
Sustainable (SUSTAIN) Bond Fund Index Posts 2.58% Return but Lags Bloomberg Barclays US Aggregate Index by 0.009%
The SUSTAIN Bond Fund Index recorded a gain of 2.58% in August, the best monthly total return result since commencement of the index as of December 2017 and a full 4.16 over the performance of the S&P 500. Still, it fell 0.009% short of the conventional Bloomberg Barclays US Aggregate Index (BB), or less than one basis point. Five of the ten funds that comprise the SUSTAIN Bond Index generated results that were equal to or greater than the 2.59% posted by Bloomberg Barclays US Aggregate Index, led by PIMCO Total Return ESG Institutional Fund and followed by the Parnassus Fixed Income Fund that generated gains of 2.83% and 2.81%, respectively. Even the lagging Praxis Impact Bond Fund I that added 2.29% in August outperformed large cap equities. Refer to Table 2 and Chart 3.
The leading funds in August achieved their results via different portfolio strategy paths. Whereas PIMCO maintained an effective maturity of 6.81 years, emphasized agency MBS and investment grade corporate credits and employed tactical currency positioning strategies, Parnassus emphasized investments in government securities and corporates with an average credit rating of A and maintained a longer-dated effective maturity of 8.23 years relative to peers. The strategy also succeeded in pushing Parnassus Fixed Income into the lead over the last 3-months and year-to-date intervals.
The SUSTAIN Bond Fund Index continues to exceed the performance of BB over the previous three-months, year-to-date, 12-month interval and since inception over which sustainable bond funds lead by 0.32%.
Sustainable (SUSTAIN) Foreign Equity Fund Index Eclipses MSCI ACWI, ex USA by 1.09%
For the first time since calculation of the SUSTAIN Foreign Equity Fund Index started as of May 31, 2019 the total return results for August exceeded the performance of the conventional MSCI ACWI ex USA (NR). The SUSTAIN Foreign Equity Fund Index posted a negative -2.00% return for a positive differential of 1.09% as eight of the ten constituent funds outperformed the MSCI ACWI ex USA Index. The best performers in August were both large cap blend funds, including the $2.2 billion Morgan Stanley Institutional International Equity Fund I, -0.8%, and the much smaller $229.9 million Boston Common ESG Impact International Fund, down -1.14%. Refer to Table 3.
Over the trailing three months, the SUSTAIN Foreign Fund Index lags by 22 basis points. Refer to Chart 4.
Performance of ESG indices versus non-ESG indices: Clear wins in August for sustainable indices, including US, foreign and emerging market equities as well as US bonds
US Equities-Sustainable US equities and funds outperformed the conventional S&P 500 Index by a range from 14 bps to 56 bps. The one exception is the MSCI KLD 400 Index that lagged the S&P 500 Index by 14 bps.
Fixed Income-The MSCI Bloomberg ESG US Aggregate Index beat the conventional Bloomberg Barclays US Aggregate Index by 9 bps while sustainable bond funds fell behind by just 1 bps.
Foreign Equities-The MSCI EAFE ESG Leaders, MSCI ACWI ex US ESG Leaders and MSCI Emerging Markets ESG Leaders bested their conventional index counterparts. The SUSTAIN Foreign Equity Fund Index outperformed them all, ending the month down -2.00%.
Refer to Chart 5.
Sustainableinvest.com
Benefits
Free access to regularly updated original research and analysis focused exclusively on sustainable finance and investing, providing investors with the guidance needed to make informed investment decisions that align with their personal values and financial goals while also contributing to the advancement of positive long-term environmental and social outcomes.
By offering financial support for our current work, either in the form of a one-time or regular contributions, you help to defray some of the costs associated with conducting our research and analysis as well as to maintain the www.sustainableinvest.com website.
Helping us to expand our research capabilities and offerings over time to cover additional relevant topics geared to sustainable investors.
Sign up to free newsletters.
By submitting this form, you are consenting to receive marketing emails from: . You can revoke your consent to receive emails at any time by using the SafeUnsubscribe® link, found at the bottom of every email. Emails are serviced by Constant Contact