Summary
• June stock and bond market performance alternated as shifting sentiments guided by strong economic growth prospects and positive geopolitical news gave way to interest rate worries and increasing concerns over a looming trade war.
• The SUSTAIN Equity Fund Index posted an increase of 0.90% in June while the SUSTAIN Bond Fund Indicator closed the month lower at -0.06%.
• Both yardsticks outperformed their corresponding S&P 500 Index and Bloomberg Barclays U.S. Aggregate Bond Index by 28 basis points (bps) and 6 basis points, respectively.
• Sustainable large-cap equity funds lagged the S&P 500 Index for the quarter, year-to-date and trailing twelve-month intervals while sustainable bond funds managed to stay ahead of the Bloomberg Barclays U.S. Aggregate Bond Index by slight margins.
June Market Performance Influenced by Strong Economic Growth Prospects and Positive Geopolitical News that Gave Way to Trade Concerns and Higher Interest Rates
Returns for the month of June reflected a best-to-worst performance range for major market segments from about 4.45% posted by the U.S. REIT sector per the Wilshire U.S. REIT Index, to about -5.46% for Asia-based stocks generally and China stocks in particular, per the FTSE China Total Return Index, as the yuan declined against the dollar due to a combination of selling on the part of investors and the Chinese central bank’s efforts to guide the currency lower as the trade conflict with the U.S. escalated. The broad measure of the U.S. stock market, captured by the S&P 500 Index, was up 0.62% while intermediate investment-grade bonds reversed course and recorded a decline of -0.12%. The segment is also down for the quarter, year-to-date and trailing twelve months as contrasted to large cap equities that are in positive territory over these intervals. Strong economic growth prospects in the second quarter and positive geopolitical news that a summit with North Korean leader Kim Jong Un and President Trump will take place gave way to concerns regarding higher interest rates and trade war tensions between the U.S., the European Union, Canada, Mexico and China.
SUSTAIN Equity Fund Index Gained 0.90% in June and Led S&P 500 Index by 28 Basis Points
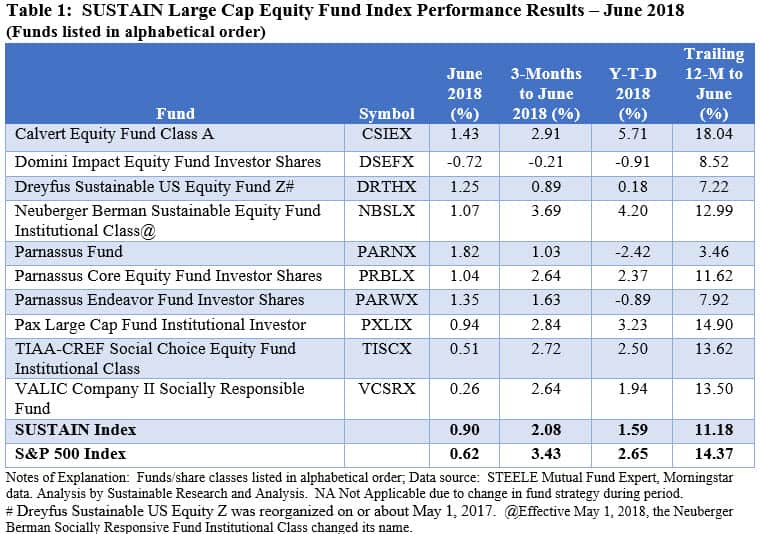
The SUSTAIN Large Cap Equity Fund Index, which tracks the total return performance of the ten largest actively managed large-cap U.S. equity oriented mutual funds that employ a sustainable investing strategy beyond absolute reliance on exclusionary practices, recorded a gain of 0.90% in June. This compared to a total return increase for the S&P 500 Index of 0.62%.
Seven of the ten constituent funds outperformed the S&P 500 Index in June, led by the Parnassus Fund. This $816.5 million value tilted fund benefited from sector positioning, for example, it’s above benchmark exposure to the best performing Real Estate sector, up 5.20% in June, and below benchmark exposure to the Information Technology sector which posted a drop of -0.31%. The fund’s performance also benefited from stock holdings in excess of 5%, including Motorola, Thomson Reuters Corp. and Alliance Data Systems Corp. each of which was up in June between 5.24% and 10.6%. At the same time, exposure to non-U.S. stocks and avoidance of energy and utility stocks detracted from performance in a month when the Utilities sector was up 3.40% and the Energy sector posted a gain of 2.51%. The same fund, however, lagged the S&P 500 Index during the second quarter and posted a negative -2.42% on a year-to-date basis. Also leading the pack during the month of June were Calvert Equity Fund A and Parnassus Endeavor Fund-Investor Shares, up 1.43% and 1.35%, respectively. Refer to Table 1.

The Domini Impact Equity Fund-Investor Shares was the only fund to post a negative total return result in June. The fund was down -0.72%, which also pulled down its 3-month return to -0.21% and its year-to-date return to -0.91%. The fund’s trailing 12-month return is 8.52%.
Performance of Sustainable Equity Funds Correlate With Energy Sector Exposure in Second Quarter
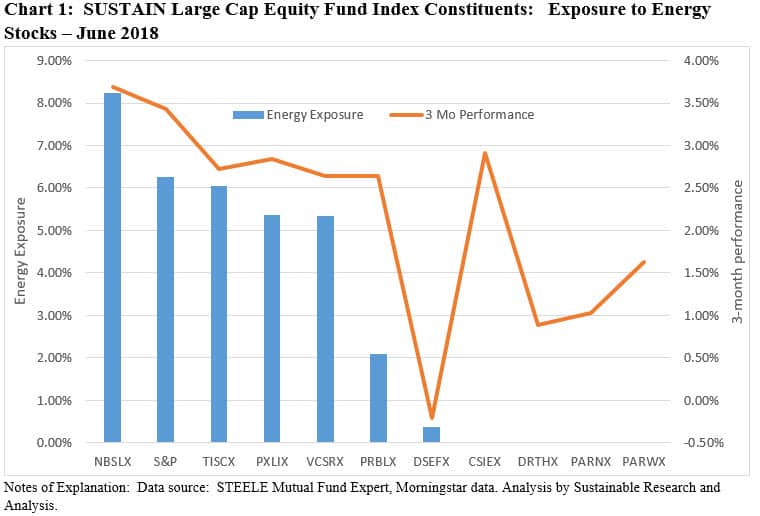
Energy was the 5th best performing sector in June, however, it was the best performer in the second quarter, up a robust 15.12% on the strength of oil prices that reached a three-year high at the end of June, and up 5.27% year-to-date. As the sector makes up 6.26% of the S&P 500 Index, sustainable funds with zero or limited exposure to Energy stocks, either due to avoidance for environmental reasons or strictly as an investment driven sector bet, are likely to be affected by the performance of the sector one way or the other. This seems to be the case for the second quarter over which the performance of sustainable equity funds is 75% correlated with energy stock holdings. That is to say, funds with energy stock exposures in line with the S&P 500 Index performed better than those with zero or more limited investments in energy stocks. Calvert Equity Fund A is the exception within the SUSTAIN Index cohort, as the fund was able to neutralize its energy avoidance during this period through effective portfolio positioning. Refer to Chart 1.

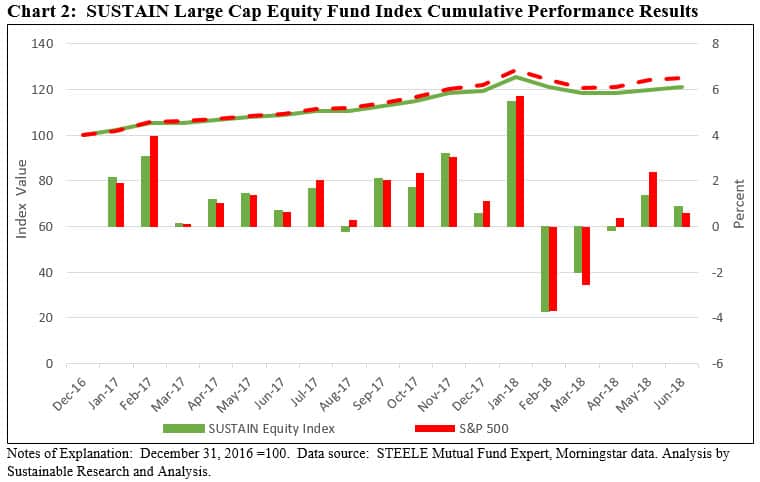
The slight outperformance on the part of the SUSTAIN Index in June relative to the S&P 500 Index narrowed the negative spread between the two indexes for the quarter, year-to-date and trailing 12-month intervals. For the 12-month period, the SUSTAIN Index posted a gain of 11.2% but it lags the S&P 500 Index by 3.2%. Refer to Chart 2. Just two funds outperformed the S&P 500 Index during this period, including Calvert Equity Fund A, up 18.04%, and Pax Large Cap Fund-Institutional Shares, up 14.9%. Both are growth oriented large cap funds, a factor that has contributed substantially to performance results during the last year. While value stocks outperformed growth oriented stocks in June, albeit by just 1 basis point, growth stocks have outperformed their value stock counterparts by substantial margins during the second quarter, year-to-date and 12-month periods.

SUSTAIN Bond Fund Indicator Posted a Slight Decline of -0.06% in June but Beat the Bloomberg Barclays U.S. Aggregate Bond Index
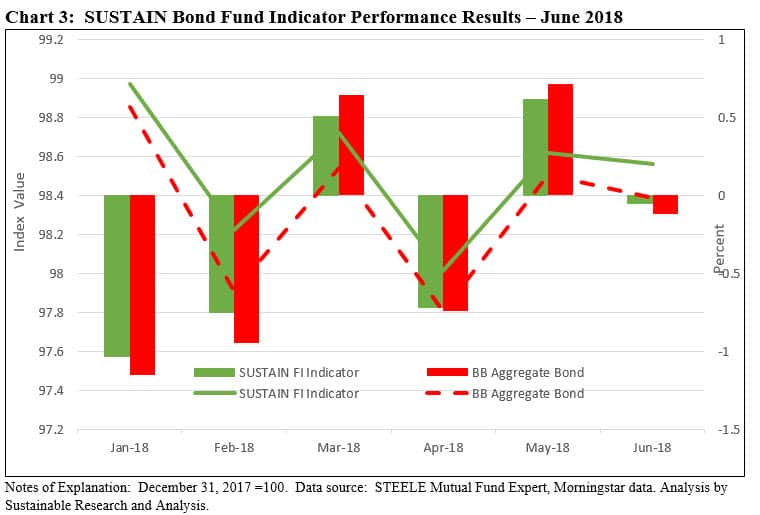
Sustainable investment-grade U.S. oriented bond funds that comprise the Sustainable (SUSTAIN) Bond Fund Indicator reversed course in June by posting a slight decline of -0.06% versus a positive total return of 0.62% in May. This was just enough to exceed by 6 bps the negative -0.12% performance recorded by the Bloomberg Barclays U.S. Aggregate Bond Index. So far this year the SUSTAIN Bond Fund Indicator has outperformed the non-sustainable Bloomberg Barclays index during each of the four months when performance results have been negative while lagging during months when results turned positive.
Four of the five funds that comprise the SUSTAIN Bond Fund Indicator outperformed the non-sustainable Bloomberg Barclays index, led by Calvert Bond Fund I. The fund, with its BBB average credit quality that falls at the lower-end of the investment-grade credit quality scale, higher exposure to corporate bonds relative to the broad index and duration of 5.2, likely benefited from its 5.06% cash position. It has led its peer group during negative months and has achieved a positive total return of 0.42% versus a negative -.40% posted by the Bloomberg index for the 12-months ended in June.
Albeit by slight margins, the SUSTAIN Bond Fund Indicator also continued to lead the Bloomberg Barclays U.S. Aggregate Bond Index over the last six and 12-months. Refer to Chart 3.

SUSTAIN Large Cap Equity Fund Index Up 0.90% in June, Leading S&P 500 Index by 28 BPS
Summary • June stock and bond market performance alternated as shifting sentiments guided by strong economic growth prospects and positive geopolitical news gave way to interest rate worries and increasing concerns over a looming trade war. • The SUSTAIN Equity Fund Index posted an increase of 0.90% in June while the SUSTAIN Bond Fund Indicator…
Share This Article:
Summary
• June stock and bond market performance alternated as shifting sentiments guided by strong economic growth prospects and positive geopolitical news gave way to interest rate worries and increasing concerns over a looming trade war.
• The SUSTAIN Equity Fund Index posted an increase of 0.90% in June while the SUSTAIN Bond Fund Indicator closed the month lower at -0.06%.
• Both yardsticks outperformed their corresponding S&P 500 Index and Bloomberg Barclays U.S. Aggregate Bond Index by 28 basis points (bps) and 6 basis points, respectively.
• Sustainable large-cap equity funds lagged the S&P 500 Index for the quarter, year-to-date and trailing twelve-month intervals while sustainable bond funds managed to stay ahead of the Bloomberg Barclays U.S. Aggregate Bond Index by slight margins.
June Market Performance Influenced by Strong Economic Growth Prospects and Positive Geopolitical News that Gave Way to Trade Concerns and Higher Interest Rates
Returns for the month of June reflected a best-to-worst performance range for major market segments from about 4.45% posted by the U.S. REIT sector per the Wilshire U.S. REIT Index, to about -5.46% for Asia-based stocks generally and China stocks in particular, per the FTSE China Total Return Index, as the yuan declined against the dollar due to a combination of selling on the part of investors and the Chinese central bank’s efforts to guide the currency lower as the trade conflict with the U.S. escalated. The broad measure of the U.S. stock market, captured by the S&P 500 Index, was up 0.62% while intermediate investment-grade bonds reversed course and recorded a decline of -0.12%. The segment is also down for the quarter, year-to-date and trailing twelve months as contrasted to large cap equities that are in positive territory over these intervals. Strong economic growth prospects in the second quarter and positive geopolitical news that a summit with North Korean leader Kim Jong Un and President Trump will take place gave way to concerns regarding higher interest rates and trade war tensions between the U.S., the European Union, Canada, Mexico and China.
SUSTAIN Equity Fund Index Gained 0.90% in June and Led S&P 500 Index by 28 Basis Points
The SUSTAIN Large Cap Equity Fund Index, which tracks the total return performance of the ten largest actively managed large-cap U.S. equity oriented mutual funds that employ a sustainable investing strategy beyond absolute reliance on exclusionary practices, recorded a gain of 0.90% in June. This compared to a total return increase for the S&P 500 Index of 0.62%.
Seven of the ten constituent funds outperformed the S&P 500 Index in June, led by the Parnassus Fund. This $816.5 million value tilted fund benefited from sector positioning, for example, it’s above benchmark exposure to the best performing Real Estate sector, up 5.20% in June, and below benchmark exposure to the Information Technology sector which posted a drop of -0.31%. The fund’s performance also benefited from stock holdings in excess of 5%, including Motorola, Thomson Reuters Corp. and Alliance Data Systems Corp. each of which was up in June between 5.24% and 10.6%. At the same time, exposure to non-U.S. stocks and avoidance of energy and utility stocks detracted from performance in a month when the Utilities sector was up 3.40% and the Energy sector posted a gain of 2.51%. The same fund, however, lagged the S&P 500 Index during the second quarter and posted a negative -2.42% on a year-to-date basis. Also leading the pack during the month of June were Calvert Equity Fund A and Parnassus Endeavor Fund-Investor Shares, up 1.43% and 1.35%, respectively. Refer to Table 1.
The Domini Impact Equity Fund-Investor Shares was the only fund to post a negative total return result in June. The fund was down -0.72%, which also pulled down its 3-month return to -0.21% and its year-to-date return to -0.91%. The fund’s trailing 12-month return is 8.52%.
Performance of Sustainable Equity Funds Correlate With Energy Sector Exposure in Second Quarter
Energy was the 5th best performing sector in June, however, it was the best performer in the second quarter, up a robust 15.12% on the strength of oil prices that reached a three-year high at the end of June, and up 5.27% year-to-date. As the sector makes up 6.26% of the S&P 500 Index, sustainable funds with zero or limited exposure to Energy stocks, either due to avoidance for environmental reasons or strictly as an investment driven sector bet, are likely to be affected by the performance of the sector one way or the other. This seems to be the case for the second quarter over which the performance of sustainable equity funds is 75% correlated with energy stock holdings. That is to say, funds with energy stock exposures in line with the S&P 500 Index performed better than those with zero or more limited investments in energy stocks. Calvert Equity Fund A is the exception within the SUSTAIN Index cohort, as the fund was able to neutralize its energy avoidance during this period through effective portfolio positioning. Refer to Chart 1.
The slight outperformance on the part of the SUSTAIN Index in June relative to the S&P 500 Index narrowed the negative spread between the two indexes for the quarter, year-to-date and trailing 12-month intervals. For the 12-month period, the SUSTAIN Index posted a gain of 11.2% but it lags the S&P 500 Index by 3.2%. Refer to Chart 2. Just two funds outperformed the S&P 500 Index during this period, including Calvert Equity Fund A, up 18.04%, and Pax Large Cap Fund-Institutional Shares, up 14.9%. Both are growth oriented large cap funds, a factor that has contributed substantially to performance results during the last year. While value stocks outperformed growth oriented stocks in June, albeit by just 1 basis point, growth stocks have outperformed their value stock counterparts by substantial margins during the second quarter, year-to-date and 12-month periods.
SUSTAIN Bond Fund Indicator Posted a Slight Decline of -0.06% in June but Beat the Bloomberg Barclays U.S. Aggregate Bond Index
Sustainable investment-grade U.S. oriented bond funds that comprise the Sustainable (SUSTAIN) Bond Fund Indicator reversed course in June by posting a slight decline of -0.06% versus a positive total return of 0.62% in May. This was just enough to exceed by 6 bps the negative -0.12% performance recorded by the Bloomberg Barclays U.S. Aggregate Bond Index. So far this year the SUSTAIN Bond Fund Indicator has outperformed the non-sustainable Bloomberg Barclays index during each of the four months when performance results have been negative while lagging during months when results turned positive.
Four of the five funds that comprise the SUSTAIN Bond Fund Indicator outperformed the non-sustainable Bloomberg Barclays index, led by Calvert Bond Fund I. The fund, with its BBB average credit quality that falls at the lower-end of the investment-grade credit quality scale, higher exposure to corporate bonds relative to the broad index and duration of 5.2, likely benefited from its 5.06% cash position. It has led its peer group during negative months and has achieved a positive total return of 0.42% versus a negative -.40% posted by the Bloomberg index for the 12-months ended in June.
Albeit by slight margins, the SUSTAIN Bond Fund Indicator also continued to lead the Bloomberg Barclays U.S. Aggregate Bond Index over the last six and 12-months. Refer to Chart 3.
Sustainableinvest.com
Benefits
Free access to regularly updated original research and analysis focused exclusively on sustainable finance and investing, providing investors with the guidance needed to make informed investment decisions that align with their personal values and financial goals while also contributing to the advancement of positive long-term environmental and social outcomes.
By offering financial support for our current work, either in the form of a one-time or regular contributions, you help to defray some of the costs associated with conducting our research and analysis as well as to maintain the www.sustainableinvest.com website.
Helping us to expand our research capabilities and offerings over time to cover additional relevant topics geared to sustainable investors.
Sign up to free newsletters.
By submitting this form, you are consenting to receive marketing emails from: . You can revoke your consent to receive emails at any time by using the SafeUnsubscribe® link, found at the bottom of every email. Emails are serviced by Constant Contact