The Bottom Line: Facing strong headwinds, sustainable fixed income ETFs experienced net inflows on a year-to-date basis to September 30th while equity funds sustained outflows.
0:00
/
0:00
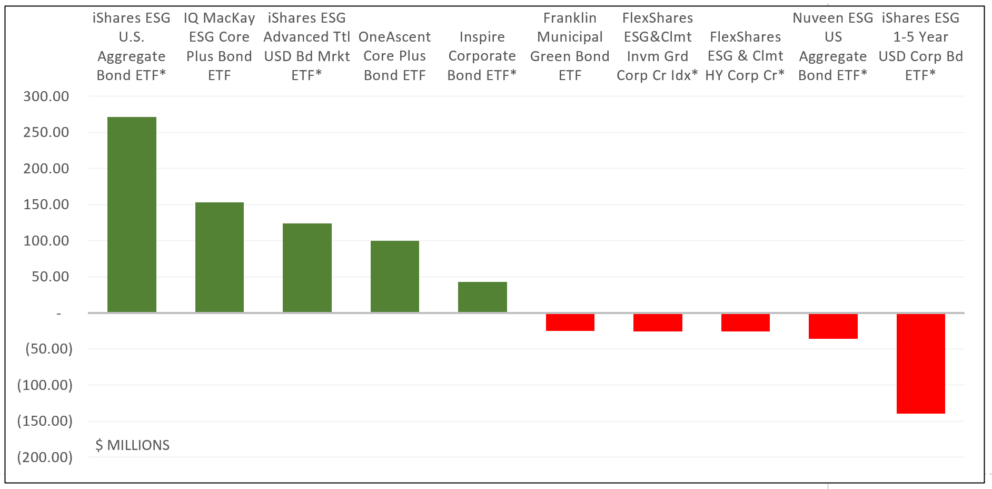
Sustainable fixed income ETFs: Top 5 ETFs based on assets gains and bottom 5 ETFs by assets declines year-to-date to September 30, 2022 Notes of Explanation: *Index tracking fund. Sources: Morningstar Direct, Sustainable Research and Analysis LLC
Observations:
- Assets attributable to sustainable ETFs, a total of 224 funds with $90.6 billion in net assets as of September 30 according to Morningstar, experienced a decline of $23.7 billion since the start of the year, or a 20.7% dip. Equities and bonds suffered steep total return declines during the first nine months of the year. All ETFs combined dropped 25.4%, equity funds gave up 27.2% while bond funds posted an average decline of 16.2%–a very unusual two-punch consequence attributable to high inflation. Drops due to market depreciation plus outflows were offset by an estimate $61.4 billion in cash inflows to limit the overall drop to $23.7 billion. That said, sustainable bond ETFs experienced net gains in assets since the start of the year while equity funds asset under management declined.
- Equity ETFs account for $90.4 billion in assets invested across 183 equity funds. This segment saw its assets decline by $24.2 billion since the start of the year, experiencing a combination of market depreciation and outflows estimated to be in the amount of $28.1 billion, offset by $3.9 billion in inflows.
- At the same time, fixed income funds gained $481.4 million, or 7%, during the same interval. Consisting of 34 actively as well as passively managed ETFs as of September 30th with $7.3 billion in net assets, fixed income ETFs experienced inflows in the amount of $1.5 billion, offsetting a combination of about $1.1 billion representing market depreciation plus estimated outflows. The gains were largely observed during the first five months or the year or so.
- Fixed income funds, which account for almost 16% of the sustainable fixed income ETF segment, realized 60.1% of the net cash flows versus passively managed fixed income funds. Actively managed fixed income, on average, outperformed passively managed funds in each of the three quarters since the start of the year. But this performance differential is largely a function of the composition of the two sub-segments with passively managed funds having more exposure to funds with high yield and emerging markets mandates.
- The top 5 ETFs track either the broad fixed income market with some variations or limit investments to corporate bonds only. Otherwise, the three index tracking funds employ ESG screening and exclusions to isolate eligible securities, however, Inspire Corporate Bond ETF (IBD) is guided by adherence to a biblical theme. As for the top two actively managed funds, in one case, IQ MacKay ESG Core Plus Bond ETF (ESGB) also employs an issuer engagement approach while in the second case, OneAscent Core Plus Bond ETF (OACP), the sub-adviser also seeks to invest a portion of the fund’s assets in impact-oriented securities that have the potential to achieve social or environmental benefits.


