The Bottom Line: Two of three Sustainable (SUSTAIN) fund indices outperformed conventional benchmarks by 44 bps and 30 bps; third index trailed by 50 bps.
Strong August equity results not shared by performance of fixed income
Large cap US stocks registered a strong 7.2% gain in August, posting their best monthly return since April when stocks rebounded after being pummeled during the full two-month February through March -19.6% drop. Intermediate investment-grade bonds, on the other hand, recorded a decline of 80 basis points in August, the worst this year. Stocks were fueled by government stimulus, Federal Reserve liquidity and near zero interest rates, signs of an economic rebound as well as what may be misplaced optimism regarding the near-term availability of a coronavirus vaccine. Large cap stocks continued to outperform their small cap counterparts and, while larger cap growth stocks led large cap value stocks, this was not the case for micro-cap, small-cap and mid-cap equities. Across style factors qualified by index provider definitions, returns ranged from a high of 11.9% recorded by the Russell Top 200 Growth Index to a low of 3.0% posted by the S&P 600 Growth Index. As to large cap industry sectors, Information Technology led with a 12.0% gain while the Utilities and Energy sectors brought up the rear with negative one-month returns of -2.7% and -1.0%, respectively.
Against a backdrop of rising long-term Treasury yields throughout August, with the 10-year Treasury yield moving up 17 bps, global fixed income returns ranged from a low of -4.5% posted by 20+ year U.S. Treasuries to a high of 2.0% registered by Caa-rated high yield bonds.
Broad-based global and international equity sectors, as measured by the MSCI ACWI and MSCI ACWI, ex USA generated returns of 4.3% and 6.2%, respectively. MSCI EAFE (net) was up 5.1% while frontier markets gained 8.3%.
Sustainable[1] mutual funds and ETFs added 3.2% on average and sustainable indices posted mixed results relative to their non-sustainable counterparts
Sustainable mutual funds and ETFs, a total of 4,660 funds/share classes covering the entire range of fund categories from money market funds to commodity funds, achieved an average gain of 3.2%. Individual fund returns ranged from a high of 25.9% to a low of -18.95% posted by Invesco Solar ETF and Camelot Premium Return Fund I, respectively.
Two of the three sustainable mutual fund indices maintained by Sustainable Research and Analysis eclipsed their conventional index counterparts by 30 bps and 44 bps, but the Sustainable (SUSTAIN) Large Cap Equity Fund Index lagged behind the S&P 500 and the S&P 500 ESG Index by 50 bps and 120 bps, in that order.
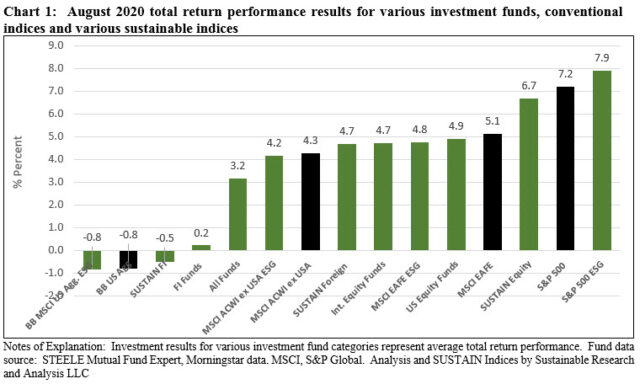
Results were also mixed for securities-based ESG indices. The S&P 500 ESG Index outperformed its non-ESG counterpart by 70 bps. The MSCI ACWI ex USA ESG lagged its non-ESG counterpart by 10 bps while the MSCI EAFE ESG Index fell behind its non-ESG counterpart by 30 bps. As for fixed income, the Bloomberg Barclays US Aggregate ESG Index performed in line with its non-ESG counterpart. Refer to Chart 1.

Sustainable (SUSTAIN) Large Cap Equity Fund Index lagged behind the conventional benchmark in August
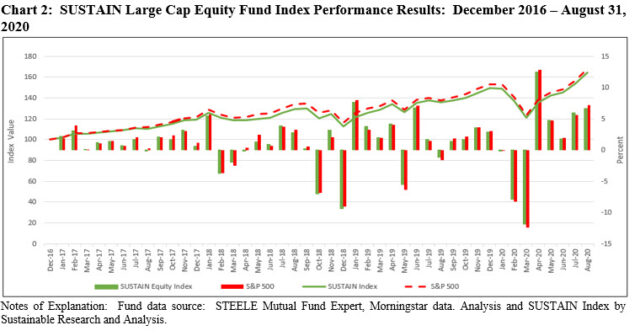
While still leading the S&P 500 year-to-date by 24 bps, the Sustainable (SUSTAIN) Large Cap Equity Fund Index lagged behind the conventional benchmark in August. The 50 bps deficit was the fifth over the course of the last eight months, however, the SUSTAIN Index’s 80 bps outperformance during the February-March market drop has been sufficient to maintain its lead since the start of the year. That said, the SUSTAIN Index lags over the trailing 12-month period by 1.02% and 4.0% since its inception at the start of 2017. Refer to Chart 2.

Only three of the ten fund constituents beat the S&P 500 in August. Pioneer Fund A, up 8.96%, led in August. The fund was also the best performer during the trailing three months and year-to-date intervals. With a return of 5.9%, the Harford Capital Appreciation Fund A came in last.
Sustainable (SUSTAIN) Bond Fund Index reversed course and posted a negative -0.51% return in August but beat the Bloomberg Barclays US Aggregate Bond Index by 30 bps
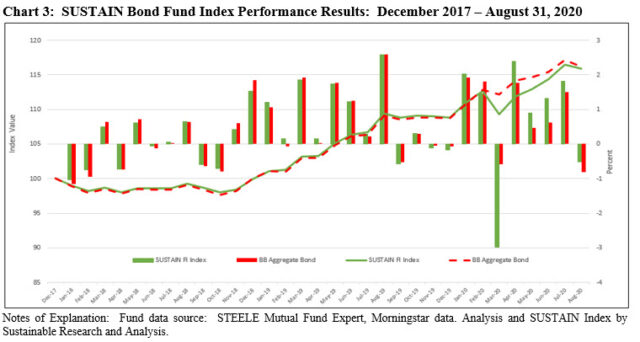
Following four consecutive months of positive returns, the SUSTAIN Bond Fund Index reversed course and turned negative in August, giving up -0.51%. This was still enough to outperform by 30 bps the conventional Bloomberg Barclays US Aggregate Bond Index that recorded a decline of -0.81%. Even with the decline in August and after experiencing a two-month drop of -1.57% during the February through March interval earlier this year for a wide 2.87% variation relative to the Bloomberg Barclays US Aggregate Bond Index, the SUSTAIN Index has managed to recover by posting five consecutive months of outperformance and adding 6.03% versus the conventional benchmark’s 3.59% during the same interval. Refer to Chart 3.
All ten funds that comprise the SUSTAIN Index outperformed in August. Returns ranged from a low of -0.76% registered by the JPMorgan Core Bond Fund R6 to a high of -0.09% posted by the Calvert Bond Fund I.

The Sustainable (SUSTAIN) Foreign Fund Index gained 4.7% in August, outperforming the MSCI ACWI ex USA by 44 bps
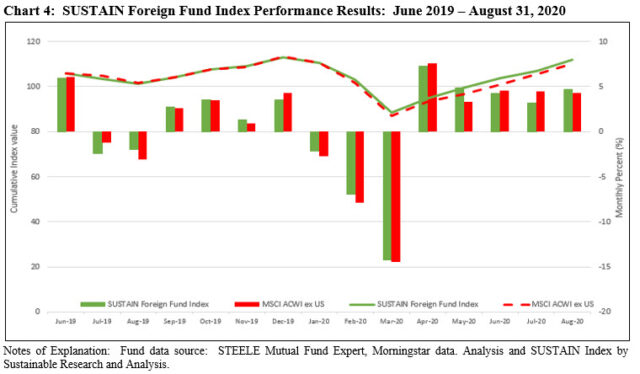
The Sustainable (SUSTAIN) Foreign Fund Index gained 4.7% in August, outperforming the MSCI ACWI ex USA by 44 bps. It thus reversed two consecutive months of underperformance that led to a 3-month 1.18% lag relative to the conventional benchmark. Still the SUSTAIN Index leads over the trailing 12-months by 2.2%. Refer to Chart 4.
The SUSTAIN Foreign Fund Index results are attributable to the excess returns achieved by eight of ten index constituents, led by DFA Sustainability Core 1, up 5.97%. At the other end of the range, BMO Pyrford International Stock I was up 2.7%.

[1] While definitions continue to evolve, sustainable investing refers to a range of five overarching investing approaches or strategies that encompass: values-based investing, negative screening (exclusions), thematic and impact investing and ESG integration. Shareholderbondholder engagement and proxy voting may also be employed along with one of more of these strategies that are not mutually exclusive.
Sustainable foreign equity and bond funds outperform in August 2020
The Bottom Line: Two of three Sustainable (SUSTAIN) fund indices outperformed conventional benchmarks by 44 bps and 30 bps; third index trailed by 50 bps.
Share This Article:
The Bottom Line: Two of three Sustainable (SUSTAIN) fund indices outperformed conventional benchmarks by 44 bps and 30 bps; third index trailed by 50 bps.
Strong August equity results not shared by performance of fixed income
Large cap US stocks registered a strong 7.2% gain in August, posting their best monthly return since April when stocks rebounded after being pummeled during the full two-month February through March -19.6% drop. Intermediate investment-grade bonds, on the other hand, recorded a decline of 80 basis points in August, the worst this year. Stocks were fueled by government stimulus, Federal Reserve liquidity and near zero interest rates, signs of an economic rebound as well as what may be misplaced optimism regarding the near-term availability of a coronavirus vaccine. Large cap stocks continued to outperform their small cap counterparts and, while larger cap growth stocks led large cap value stocks, this was not the case for micro-cap, small-cap and mid-cap equities. Across style factors qualified by index provider definitions, returns ranged from a high of 11.9% recorded by the Russell Top 200 Growth Index to a low of 3.0% posted by the S&P 600 Growth Index. As to large cap industry sectors, Information Technology led with a 12.0% gain while the Utilities and Energy sectors brought up the rear with negative one-month returns of -2.7% and -1.0%, respectively.
Against a backdrop of rising long-term Treasury yields throughout August, with the 10-year Treasury yield moving up 17 bps, global fixed income returns ranged from a low of -4.5% posted by 20+ year U.S. Treasuries to a high of 2.0% registered by Caa-rated high yield bonds.
Broad-based global and international equity sectors, as measured by the MSCI ACWI and MSCI ACWI, ex USA generated returns of 4.3% and 6.2%, respectively. MSCI EAFE (net) was up 5.1% while frontier markets gained 8.3%.
Sustainable[1] mutual funds and ETFs added 3.2% on average and sustainable indices posted mixed results relative to their non-sustainable counterparts
Sustainable mutual funds and ETFs, a total of 4,660 funds/share classes covering the entire range of fund categories from money market funds to commodity funds, achieved an average gain of 3.2%. Individual fund returns ranged from a high of 25.9% to a low of -18.95% posted by Invesco Solar ETF and Camelot Premium Return Fund I, respectively.
Two of the three sustainable mutual fund indices maintained by Sustainable Research and Analysis eclipsed their conventional index counterparts by 30 bps and 44 bps, but the Sustainable (SUSTAIN) Large Cap Equity Fund Index lagged behind the S&P 500 and the S&P 500 ESG Index by 50 bps and 120 bps, in that order.
Results were also mixed for securities-based ESG indices. The S&P 500 ESG Index outperformed its non-ESG counterpart by 70 bps. The MSCI ACWI ex USA ESG lagged its non-ESG counterpart by 10 bps while the MSCI EAFE ESG Index fell behind its non-ESG counterpart by 30 bps. As for fixed income, the Bloomberg Barclays US Aggregate ESG Index performed in line with its non-ESG counterpart. Refer to Chart 1.
Sustainable (SUSTAIN) Large Cap Equity Fund Index lagged behind the conventional benchmark in August
While still leading the S&P 500 year-to-date by 24 bps, the Sustainable (SUSTAIN) Large Cap Equity Fund Index lagged behind the conventional benchmark in August. The 50 bps deficit was the fifth over the course of the last eight months, however, the SUSTAIN Index’s 80 bps outperformance during the February-March market drop has been sufficient to maintain its lead since the start of the year. That said, the SUSTAIN Index lags over the trailing 12-month period by 1.02% and 4.0% since its inception at the start of 2017. Refer to Chart 2.
Only three of the ten fund constituents beat the S&P 500 in August. Pioneer Fund A, up 8.96%, led in August. The fund was also the best performer during the trailing three months and year-to-date intervals. With a return of 5.9%, the Harford Capital Appreciation Fund A came in last.
Sustainable (SUSTAIN) Bond Fund Index reversed course and posted a negative -0.51% return in August but beat the Bloomberg Barclays US Aggregate Bond Index by 30 bps
Following four consecutive months of positive returns, the SUSTAIN Bond Fund Index reversed course and turned negative in August, giving up -0.51%. This was still enough to outperform by 30 bps the conventional Bloomberg Barclays US Aggregate Bond Index that recorded a decline of -0.81%. Even with the decline in August and after experiencing a two-month drop of -1.57% during the February through March interval earlier this year for a wide 2.87% variation relative to the Bloomberg Barclays US Aggregate Bond Index, the SUSTAIN Index has managed to recover by posting five consecutive months of outperformance and adding 6.03% versus the conventional benchmark’s 3.59% during the same interval. Refer to Chart 3.
All ten funds that comprise the SUSTAIN Index outperformed in August. Returns ranged from a low of -0.76% registered by the JPMorgan Core Bond Fund R6 to a high of -0.09% posted by the Calvert Bond Fund I.
The Sustainable (SUSTAIN) Foreign Fund Index gained 4.7% in August, outperforming the MSCI ACWI ex USA by 44 bps
The Sustainable (SUSTAIN) Foreign Fund Index gained 4.7% in August, outperforming the MSCI ACWI ex USA by 44 bps. It thus reversed two consecutive months of underperformance that led to a 3-month 1.18% lag relative to the conventional benchmark. Still the SUSTAIN Index leads over the trailing 12-months by 2.2%. Refer to Chart 4.
The SUSTAIN Foreign Fund Index results are attributable to the excess returns achieved by eight of ten index constituents, led by DFA Sustainability Core 1, up 5.97%. At the other end of the range, BMO Pyrford International Stock I was up 2.7%.
[1] While definitions continue to evolve, sustainable investing refers to a range of five overarching investing approaches or strategies that encompass: values-based investing, negative screening (exclusions), thematic and impact investing and ESG integration. Shareholderbondholder engagement and proxy voting may also be employed along with one of more of these strategies that are not mutually exclusive.
Sustainableinvest.com
Benefits
Free access to regularly updated original research and analysis focused exclusively on sustainable finance and investing, providing investors with the guidance needed to make informed investment decisions that align with their personal values and financial goals while also contributing to the advancement of positive long-term environmental and social outcomes.
By offering financial support for our current work, either in the form of a one-time or regular contributions, you help to defray some of the costs associated with conducting our research and analysis as well as to maintain the www.sustainableinvest.com website.
Helping us to expand our research capabilities and offerings over time to cover additional relevant topics geared to sustainable investors.
Sign up to free newsletters.
By submitting this form, you are consenting to receive marketing emails from: . You can revoke your consent to receive emails at any time by using the SafeUnsubscribe® link, found at the bottom of every email. Emails are serviced by Constant Contact