The Bottom Line: Sustainable mutual funds and ETFs regained their momentum in July, closing the month at slightly above $2.7 trillion in assets under management.
Sustainable mutual funds and ETFs[1] regained their momentum in July, closing the month at slightly above $2.7 trillion
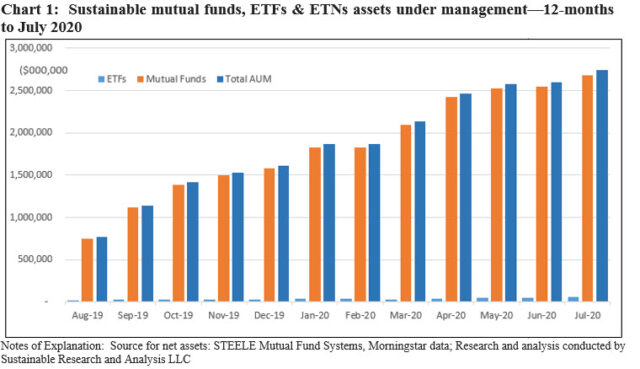
Sustainable mutual funds and ETFs regained their momentum in July as did the general market that posted a strong 5.64% increase, according to the S&P 500, while sustainable funds recorded an average total return gain of 4.11%. Adding $137 billion in net assets, versus $23.4 billion last month, sustainable mutual funds and ETFs registered their 11th consecutive new month-end high of $2,739.6 billion in assets, or an increase of 5.3%. Refer to Chart 1.
Sustainable mutual funds ended the month at $2,682.7 billion, posting an increase of 5.1% for the best month-over-month gain since May of the year. During the last three months, mutual funds added a combined total of $262.8 billion.
ETFs, which gained $5.6 billion, recorded an increase of 11% to end the month at $56.9 billion in assets. This was likewise the best gain of the last three months for ETF assets gains that increased by $5 billion in May and $3 billion in June of this year.
Cash flows: July’s $137 billion gain was bolstered by market movement
July’s $137 billion gain was bolstered by market movement that added an estimated $84.2 billion and accounted for 61% of the monthly increase. This was the second best contributor so far this year, second only to the $128.7 billion gain achieved in April.
Estimated net cash flows, including money market funds, remained negative in July as $2.5 billion came out of sustainable funds. Excluding money market funds, flows were positive to the tune of an estimated $4.9 billion. Fund re-brandings ticked up, sourcing $55.3 billion in new assets. Sustainable fixed income funds experienced the largest net cash inflows, realizing an estimated $50.0 billion.
Fund re-brandings rose in July, adding $55 billion from three firms across 29 funds
Fund re-brandings rose in July, adding $55.3 billion across 29 funds versus just $882.9 million the previous month.
Three firms contributed to the $55.3 billion in fund re-brandings, but Goldman Sachs was responsible for 78% of the increase with the repurposing of 21 funds (144 share classes) and a combined total of $43.3 billion in assets. The firm has now moved into the ranks of the top 20 sustainable fund firms, placing 11th with $47.6 billion in sustainable fund assets. Refer to Table 1 and Table 3.
Two newcomers, including Delaware Management and Mercer Investments added eight funds in total with $12.0 billion in assets.

Institutional only funds as a percent of assets remains unchanged while index funds added $5.5 billion in assets
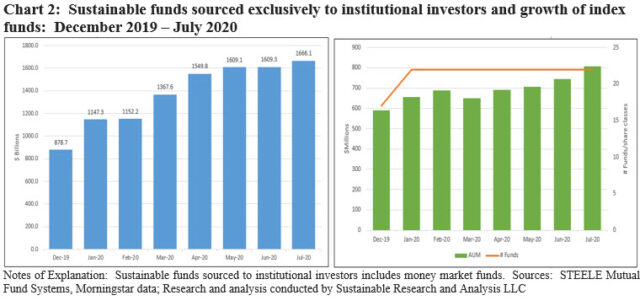
Institutional only fund assets, including money market funds, reached almost $1.7 trillion at the end of July relative to $1.61 trillion in June, but remain largely unchanged at 62.1% of sustainable fund assets. Excluding money market funds, institutional only funds came in at $1.0 trillion and 50.8% of sustainable fund assets. These numbers likely understate the level of institutional investments in mutual funds as other than institutional only funds/share classes can serve as entry points for investments in funds by institutional investors. Refer to Chart 2.
Index funds added $5.5 billion or 10.1% to end the month of July with $59.9 billion in net assets. Northern Trust introduced a new share class to its Northern Global Sustainability Index, boosting by $410.9 million the assets of the MSCI World ESG Leaders Index mutual fund tracker that provides exposure to companies with high environmental, social and governance performance relative to their sector peers. In addition, State Street launched the SPDR S&P 500 ESG ETF that tracks the performance the S&P 500 ESG Index. This is the second S&P 500 ESG ETF index tracker that seeks to replicate the performance of the relatively new S&P index released in early 2019, adding to a similar ETF brought to market by DWS in June 2019, the $239.1 million Xtrackers S&P 500 ESG ETF. Refer to Chart 2.
Allocation of fund assets shifts modestly in favor of fixed income funds
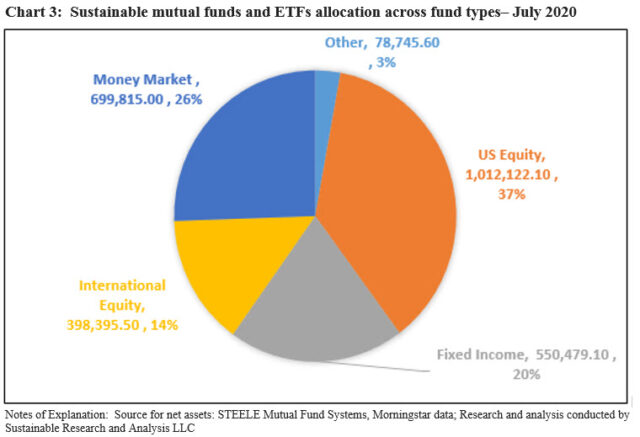
The month-over-month allocation of assets across fund categories shifted modestly in favor of fixed income funds that gained $61.7 billion in assets and lifted the percent allocation to taxable and municipal bond funds to 20% from 19% last month. Money market funds gave up $4 billion while international funds, which remain at 14% of total assets, dropped $22.5 billion. Refer to Chart 3.
Twelve new funds were added in July, including two nontransparent actively managed ETFs
12 new sustainable funds were launched in July, including four new ETFs, sourcing a total of $306.1 million in assets. Particularly notable was the introduction of two American Century ETFs, one seeking to align investments with the United Nations Sustainable Development Goals (SDGs) by identifying companies that generate, or could generate, social and environmental impact alongside a financial return while the second integrates ESG. These funds are actively managed, nontransparent exchange-traded funds. In lieu of publishing their portfolio contents daily, the funds publish proxy portfolios each day.
Green bond funds reach $807.2 million at the end of July, likely to reach $1 billion by year-end
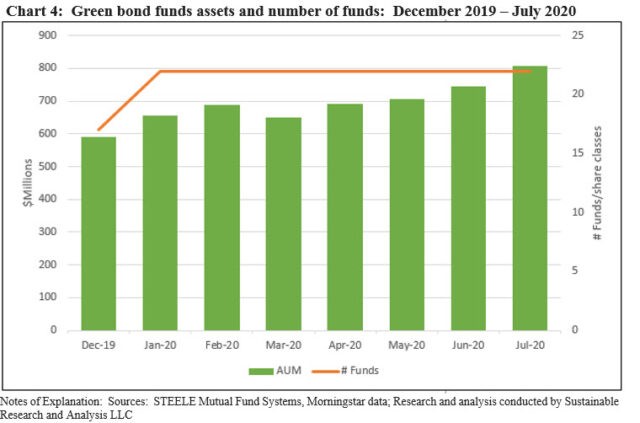
The eight green bond mutual funds and ETFs (25 funds/share classes in total) offered by eight firms, surpassed $800 million in assets for the first time at the end of July, reaching $807.2 million with the benefit of a month-over-month 8% July gain of $65.2 million attributable to new money along with market movement. July’s green bond funds increase represents the second best monthly gain since the first green bond fund was launched by Calvert Investment Management in October 2013. It comes on the heels of recent green bond issuances that synchronize with the uptick observed in July when $20 billion in labelled green bonds were issued following increasing volumes over the previous three months. Barring a market reversal, both green bond fund assets and green bond issuances are expected to achieve further gains this year, with green bond funds likely to reach $1 billion on or before year-end while green bond issuance dynamics could take 2020 volumes beyond last year’s $257.5 billion level. This, even considering the recent announcement that one of the eight firms to offer a green bond fund has made a decision to liquidate its fund. Allianz Global Investors announced on August 25th that it will be liquidating its $29.7 million green bond fund. Launched in November 2018, the fund has not managed to attract assets and gain traction beyond the Allianz’s seed capital. The decision may be linked to the firm’s recently announced strategic partnership agreement with Virtus Investment Partners, Inc. Refer to Chart 4.
Sector focus: Health care funds
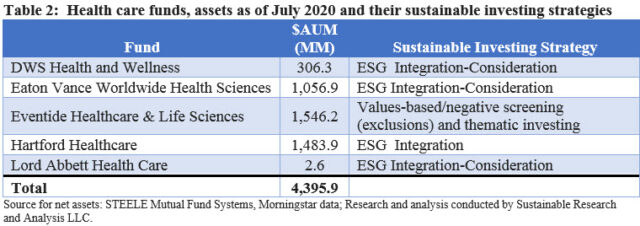
Five investment management firms offer five health care mutual funds (30 funds/share classes in total, none are ETFs) that explicitly reflect sustainable investment considerations in their investment decision making. One fund was added to the sector in March of this year when the relatively new Lord Abbett Health Care Fund was rebranded by adopting prospectus language to explicitly reflect that it may consider ESG factors.
Sustainable health care funds have accumulated $4.4 billion in assets as of July 31st, up just slightly from $4.3 billion at the start of the year, even in the light of very solid performance results relative to the S&P 500 on a year-to-date and trailing 12-month basis as the world continued to look to the health care sector for solutions to the COVID-19 pandemic, whether through diagnostics, vaccines or therapeutics. The 30 funds/share classes posted year-to-date and trailing 12-month average returns to July 31st of 7.6% and 21.3%, respectively, versus the S&P 500 that was up 2.38% and 11.96% over the same two time intervals. Refer to Table 2.
While an argument can be made that health care funds in general qualify as sustainable funds on the basis of their thematic social orientation, the category, which otherwise consists of 162 funds/share classes, is limited to funds that explicitly employ a sustainable approach to investing. Dominating the category is the $1.5 billion thematic-oriented Eventbrite Healthcare & Life Sciences Fund that employs a values-based negative screening approach. The other four funds in the category have adopted the following two strategies: ESG Integration-Consideration (ESG may be factored into investment decisions) and ESG Integration (ESG is accounted for in investment decision making while investee engagement and/or proxy voting may also be employed).
Shift in top 20 sustainable fund firms due to the closing of the merger transaction between Franklin Resources and Legg Mason does not result in a material change in the profile of the dominant sustainable investment strategies
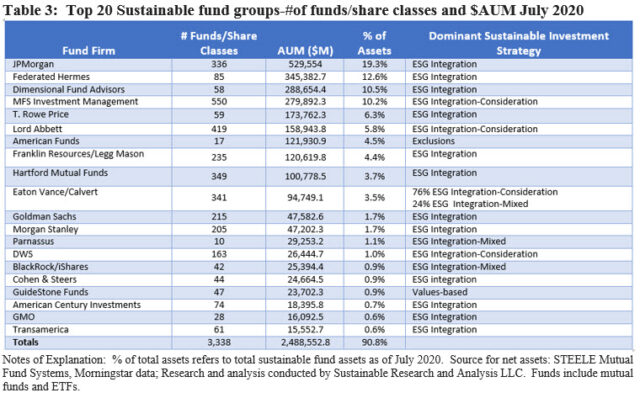
The July 31 closing of the previously announced merger transaction between two publicly listed firms Franklin Resources, Inc. (NYSE: BEN) and Legg Mason, Inc. (NYSE: LM) took effect as scheduled. This transaction along with the July rebranding of funds on the part of Goldman Sachs changed the composition of the top 20 sustainable fund firms that account for 90.8% of sustainable fund assets under management.
These two developments, however, did not have a material impact on the market share represented by the top 20 firms that shifted slightly from 91.2% at the end of June. Nor was there a material change in the profile of the dominant sustainable investment strategies pursued by the top 20 firms. ESG Integration strategies accounted for 66% of assets. ESG Integration-Consideration approaches accounted for 22% of assets and ESG Integration-Mixed, which refers to funds whose core strategy consists of ESG integration, but exclusions, impact or thematic approaches may also be employed, accounted for 7% of assets. Refer to Table 3.
[1] While definitions continue to evolve, sustainable investing refers to a range of five overarching investing approaches or strategies that encompass: values-based investing, negative screening (exclusions), thematic and impact investing and ESG integration. Shareholder/bondholder engagement and proxy voting may also be employed along with one of more of these strategies that are not mutually exclusive.


