The Bottom Line: Sustainable funds took a breather in June but still managed to record a tenth consecutive monthly assets high of almost $2.6 trillion.
Sustainable mutual funds and ETFs[1] took a breather in June, adding just $23.4 billion, but still managed to record a tenth consecutive monthly high of almost $2.6 trillion
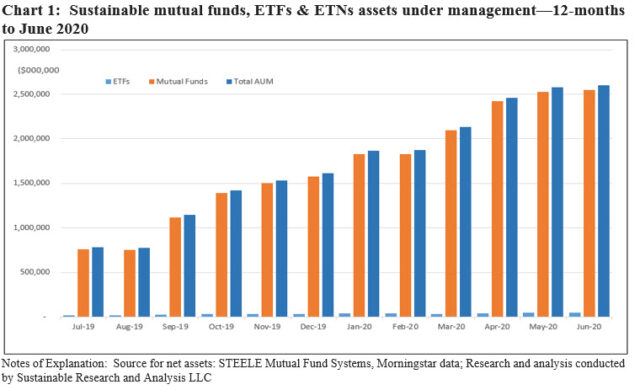
Sustainable mutual funds and ETFs took a breather in June, adding just $23.4 billion for a gain of 0.91%. While this was the narrowest month-over-month gain since February and below the average 2.52% total return registered by sustainable funds in June, the segment still managed to reach a tenth monthly consecutive new high of $2,599.2 billion. Refer to Chart 1.
Mutual fund assets increased by $20.4 billion to end at $2.599 trillion, recording a gain of only 0.8%. At the same time, ETFs added $3.0 billion and gained 6.2%, expanding slightly to 1.97% their relative contribution to sustainable assets.
In the second quarter, combined assets increased by $465.5 billion or 21.8% compared to 32.4% in the first quarter of 2020. ETFs added $15.9 billion, recording a gain of 44.8% that benefited from additions of almost $5.0 billion in May and $7.9 billion in April.
Market movement was the single largest contributor to the June increase in assets
Again in June, market movement was the single largest contributor to the increase in net assets, adding an estimated $47.0 billion, including money market funds. This was followed by estimated net cash outflows of $24.5 billion and fund re-brandings at $875.4 million. Money market funds in particular recorded a drawdown of $27.4 billion or 3.8% of assets. Excluding money market funds, cash flows were positive and added an estimated $3.0 billion.
Sustainable international mutual funds and ETFs experienced outflows estimated at $2.8 billion while ETFs more generally recorded inflows of $1.5 billion into fixed income funds.
Fund re-brandings slowed in June to the lowest level since October 2018
After adding an average $140 billion per month in assets due to re-brandings over the previous 12 months, the repurposing of existing funds slowed to the lowest level since October 2018. Only five funds (13 funds/share classes) with total net assets in the amount of $882.9 million were re-branded. Refer to Table 1.
Two of the four firms that repurposed funds in June are newcomers to the sustainable investing segment. These include Angel Oak Capital Advisors with its addition of a short-term bond fund that had been in operation since 2014 and Jaguar Listed Property that re-branded its $7.5 million Jaguar Global Property Institutional Fund in operation since December 2016.

Allocation of fund assets shifts just slightly due to drop in money market fund assets
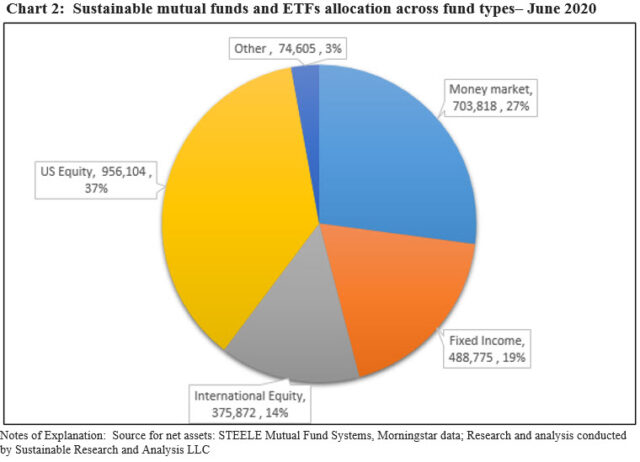
The allocation of fund assets shifted just slightly in June due to the $27.4 billion month-over-month decline in money market fund assets referenced above that dropped the segment’s market share to 27.1% from 28.4% the month prior. US Equity funds, including both diversified and sector funds, which stood at $956.1 billion and a 36.8% market share, continue in the lead by a wide margin. Refer to Chart 2.
Institutional funds maintain their dominance while index funds lag
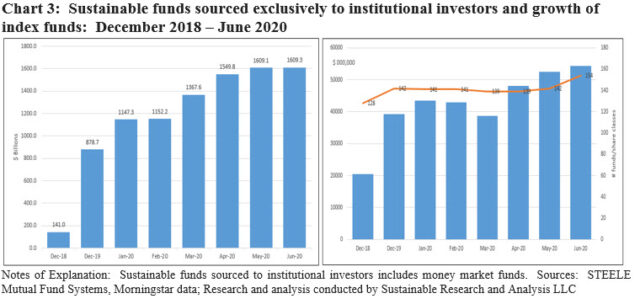
Institutional only fund assets, including money market funds, reached $1.61 trillion, or about 62% of sustainable fund assets. Excluding money market funds, institutional only sustainable funds reached $948.7 billion, or 45.5% of the segment’s assets. These numbers likely understate the level of institutional investments in mutual funds as other than institutional only funds/share classes can serve as entry points for investments in funds by institutional investors.
At the same time, sustainable index funds ended June at $54.4 billion in assets, representing 3% of long-term sustainable assets. $35.6 billion or 65.4% of the total is sourced to ETFs. The growth of sustainable index funds in the aggregate has slowed since 2019 when the year-over-year growth rate was 91.3%. Refer to Chart 3.
New fund launches picked up the pace in June and in the second quarter
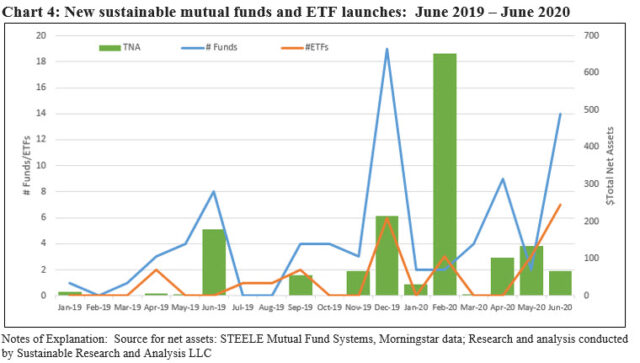
A total of 21 funds were launched by ten firms in June, the largest single monthly number since the start of the year. These included 14 new mutual funds and seven iShares ETFs, rolled out throughout the month by BlackRock. Two impact-oriented funds were also launched by BlackRock along with funds introduced by Goldman Sachs, Janus Henderson, Lazard and MFS Investment Management, to mention some. Refer to Chart 4.
A total of 35 mutual funds and ETFs were launched in the second quarter, as compared to 11 funds in the first quarter.
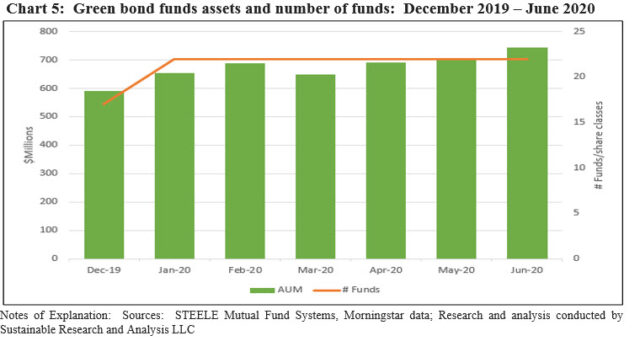
Green bond funds end 1H with $744.7 million, gaining $37.4 million
Green bond funds added $34.7 million in June, up 5% from $707.3 million in May. Much of the increase was realized by the Calvert Green Bond Fund I Shares, an institutional share class that added $26 million and iShares Global Green ETF that added $6.3 million during the month.
Green bond funds recorded a gain of $95.8 million, or 4.8%, in the second quarter and are up a strong $154.1 million, or 26.1%, in the first half of the year. Refer to Chart 5.
Market share of top 20 sustainable fund firms remains largely unchanged at 91.2%
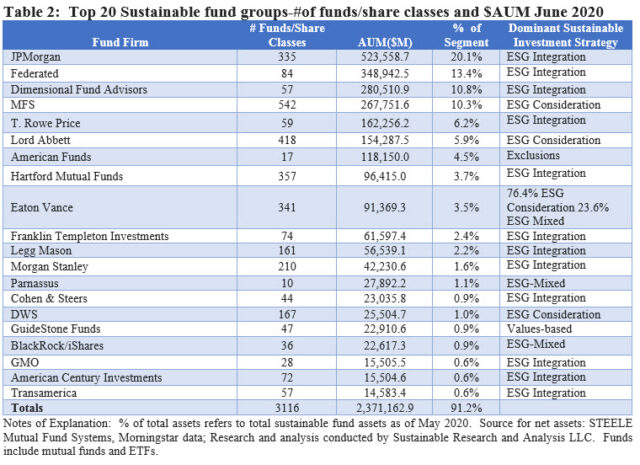
At the end of June, the roster of firms offering sustainable mutual funds and ETFs increased to 182 firms as four first time fund firms introduced sustainable investment products, either with new fund launches, as was the case with Janus Capital Management, LLC and Lazard Asset Management LLC, or fund re-brandings as was the case with Angel Oak Capital Advisors LLC and Jaguar Listed Property LLC. At the same time, one firm, Miller Howard, dropped out when its single sustainable fund offering, the Miller/Howard Income-Equity Fund was liquidated on or about June 15, 2020.
Leading sustainable investing strategies across the top 20 firms include ESG Integration, accounting for 69% of assets, ESG Integration-Consideration, accounting for 22% of assets and Exclusions that make up 4.5% of assets. Refer to Table 2.
Sector focus: High yield funds
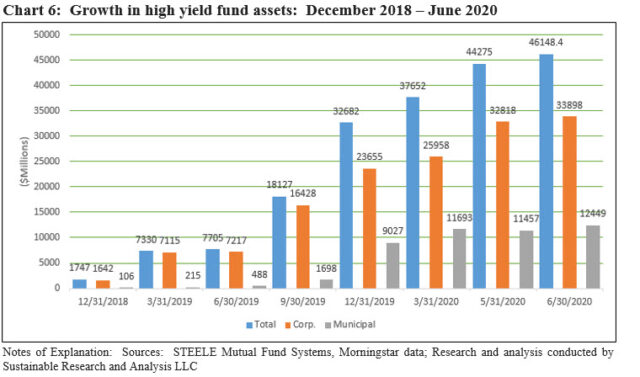
High yield fund assets end June at $46.1 billion sourced to 40 taxable and municipal funds
The number and assets under management of sustainable high yield corporate and municipal mutual funds and ETFs grew dramatically in the last 18-months, expanding from $1.7 billion at the end of 2018 to $46.1 billion at the end of June 2020. The number of fund offerings increased from seven funds (23 funds/share classes) to 42 funds (178 funds/share classes). The number of fund firms offering products expanded from 7 fund firms to 25 firms during the same time interval. Refer to Chart 6.
This was largely due to the rebranding of existing funds by conventional asset management firms that formally amended selected fund prospectuses to reflect the adoption of a sustainable investing strategy. While not the only ones, firms like Shenkman, Neuberger Berman, Transamerica, Eaton Vance, MFS, Lord Abbett and J.P. Morgan all contributed to this trend that picked up significant momentum starting in 2019.
In fact, high yield sustainable funds grew at a faster pace since the start of 2019 relative to the sustainable funds segment more generally (26X vs. 5.6X), but the segment is dominated by funds that have adopted an ESG Integration-Consideration strategy, that is, ESG factors may be considered in investment decisions—a less definitive commitment in contrast to funds that formally and explicitly commit to doing so.
[1] While definitions continue to evolve, sustainable investing refers to a range of five overarching investing approaches or strategies that encompass: values-based investing, negative screening (exclusions), thematic and impact investing and ESG integration. Shareholder/bondholder engagement and proxy voting may also be employed along with one of more of these strategies that are not mutually exclusive.


