The Bottom Line: In one of the most volatile months in stock market history, the assets of sustainable funds broke through the $2 trillion level.
Sustainable mutual fund and ETF assets exceed $2 trillion for first time at the end of March
The month of March has been one of the most volatile in stock market history, as the world-wide corona virus pandemic produced a simultaneous health crisis, financial crisis and potentially widespread business failures. Even as mutual funds and ETFs posted an average total return decline of -11.94% against an S&P 500 Index decline of -12.35%, sustainable fund assets broke through the $2 trillion level for the first time. Sustainable funds and ETFs added a net of $262.7 billion, for an increase of 14%[1]. Refer to Chart 1.
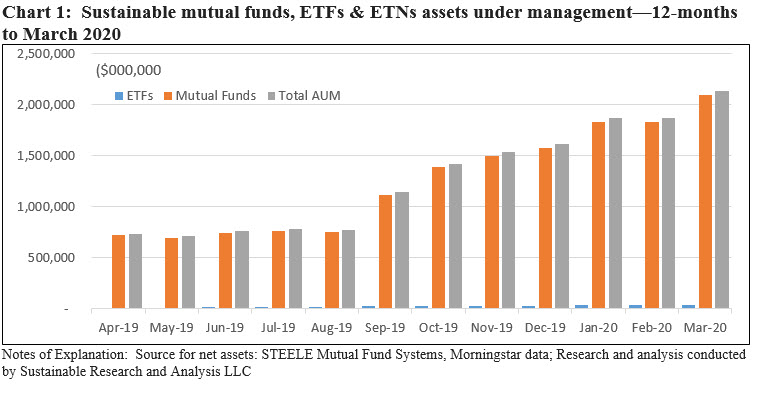
Mutual funds gained $267.1 billion, or 15%, to end March with $2.1 trillion in assets while ETFs dropped a net of $4.4 billion, registering an 11% decline, to end the first quarter with $35.4 billion. The decline was largely attributable to market deprecation while net positive fund inflows added about $167 million. ETFs now make up about 1.7% of total sustainable fund assets, down from a high of 2.52% of total assets reached as of September 30, 2019. The growth of sustainable mutual fund assets continues to benefit from mutual fund re-brandings, a development that has largely but not entirely skipped over ETFs. Since the start of 2019 through the end of 1Q 2020, 15 ETFs were re-branded, shifting a total of $ 9.6 billion in assets. This just a small 1% fraction when compared to 649 mutual funds and almost $1.8 billion in re-branded mutual fund assets.
Estimated cash inflows in March bring in $220.3 billion, including money market funds, while market depreciation draws down $152.9 billion
Including money market funds, which stood at $653.5 billion or 30.6% of sustainable fund assets at the end of March, the segment experienced estimated net inflows of $220.3 billion in March and market deprecation registered an estimated decline of -$152.9 billion. In both cases, these were the largest monthly estimated inflows and market deprecation experienced by the sustainable funds segment—a function of the segment’s increased scale.
Fund re-brandings (see below) added $352.8 billion. Excluding money market funds, net inflows were an estimated $157.3 billion.
Fund re-brandings reach the highest level in the previous 12-months based on number of funds
Fund re-brandings in March reached the highest level in the previous 12-months based on the number of funds re-branded and second highest level based on assets, with the addition of $352.8 billion in net assets. Refer to Chart 2.
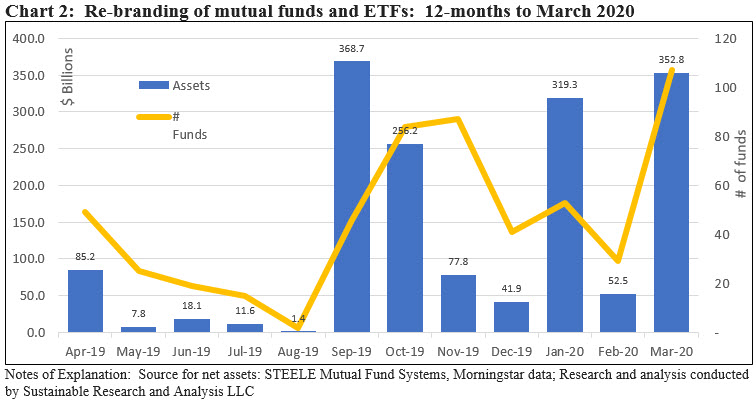
11 firms repositioned both mutual funds and ETFs. Dimensional Funds alone re-branded 48 funds with $234 billion in assets while Lord Abbett repurposed 32 funds with $109.6 billion in assets. This is on top of 8 funds with $16.2 billion in assets that were re-branded by Lord Abbett in February.
Both firms adopted ESG integration language in fund prospectuses but in the case of Lord Abbett the investment team may but apparently is not obligated to consider ESG factors in investment decisions.
Allocation across fund types/asset classes: International funds gain due to re-brandings;
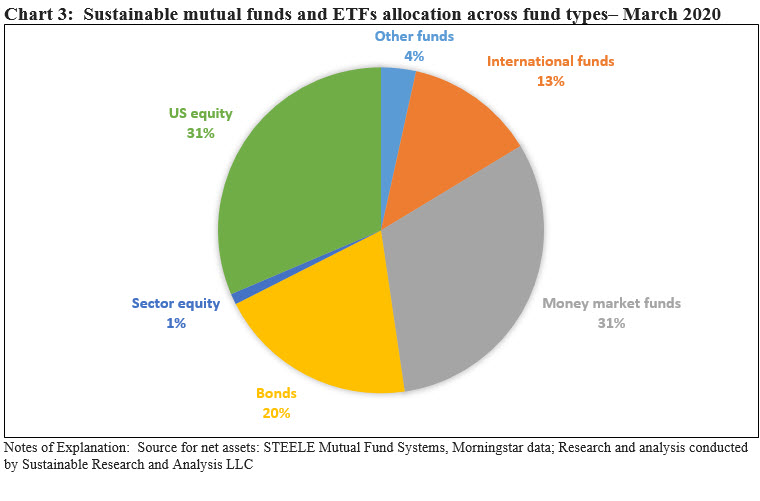
International funds gained $82.7 billion in assets, adding 2% to reach 15% of total sustainable fund assets, fueled by foreign fund re-brandings on the part of DFA, American Century and Lord Abbett. While money market fund assets gained $67.4 billion, their share of market, as is the case with the other fund categories, remained unchanged. Refer to Chart 3.
Sustainable index funds register a second consecutive month-over-month decline of $4.4 billion
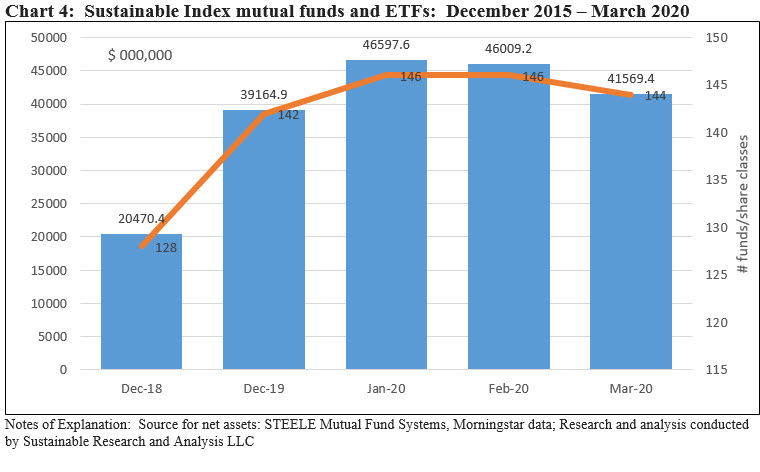
Sustainable index funds, including mutual funds and ETFs registered a second consecutive decline in March, giving up $4.4 billion due largely to market movement. Two ETFs liquidated, including the $14.7 million Columbia Sustainable Global Equity ETF and the smaller $6.1 million Organics ETF managed by Janus Capital Management. Index fund assets now account for 1.9% of the segment’s assets under management. Refer to Chart 4.
Institutional only mutual funds, including money market funds, gained $215.4 billion and end March at almost $1.4 trillion
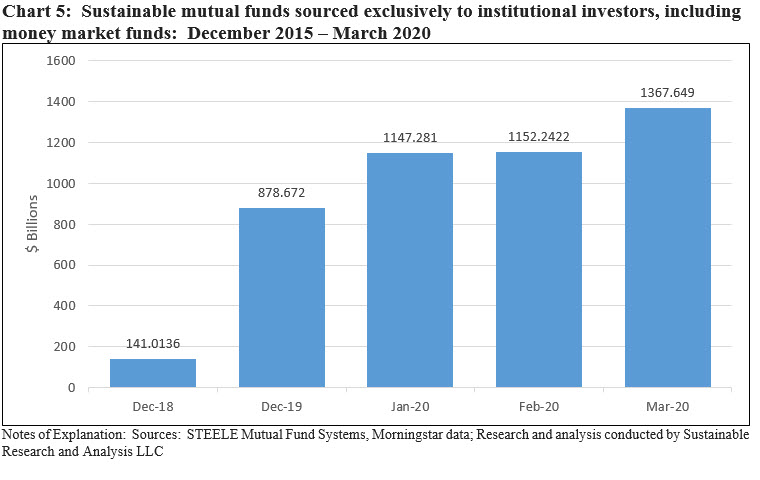
Adding $215.4 billion in March, institutional fund assets reached $1,367,649 million, representing a minimum of at least 65.2% of assets sourced to institutional investors as of 1Q 2020. The number is likely higher as institutional investors are not limited to invest via institutional only share classes. Refer to Chart 5.
New Funds: Four new funds were launched in March
Four new sustainable mutual funds were launched during the month versus two funds in February, adding just $4.5 million in net assets as contrasted to an average of $101.4 million in new fund assets per month over the previous 12-month interval. That said, the monthly average was bounded by a low of $0.0 to a high of $651.9 million that was sourced last month due to the seed funding of an iShares ETF by Finland’s largest pension fund.
Two of the new funds were launched by WCM Investment Management Company. This is the firm’s first time addition to the sustainable funds sphere.
Fund specific flows in March
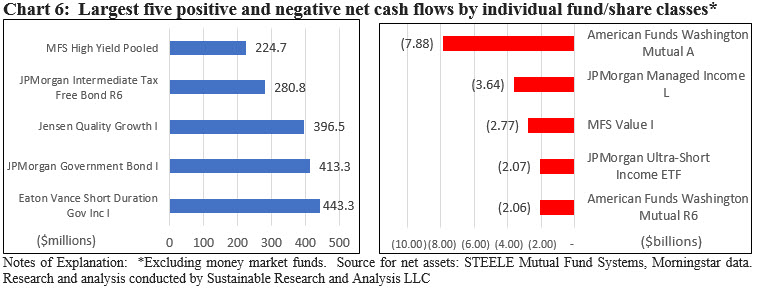
Excluding money market funds, the five funds/share classes with the greatest changes in net assets in March due to market movement as well as flows varied as to fund type and ranged from $224.7 recorded by MFS High Yield Pooled Fund to the Eaton Vance Short Duration Government Income Fund I that added a net of $443.3 million. Refer to Chart 6.
At the other end of the range, declines in assets ranged from a high of $7.9 billion sustained by Washington Mutual Fund A to $2.06 billion sustained by the R6 share class of the same fund.
Top 20 sustainable fund firms account for 92% of sustainable fund assets
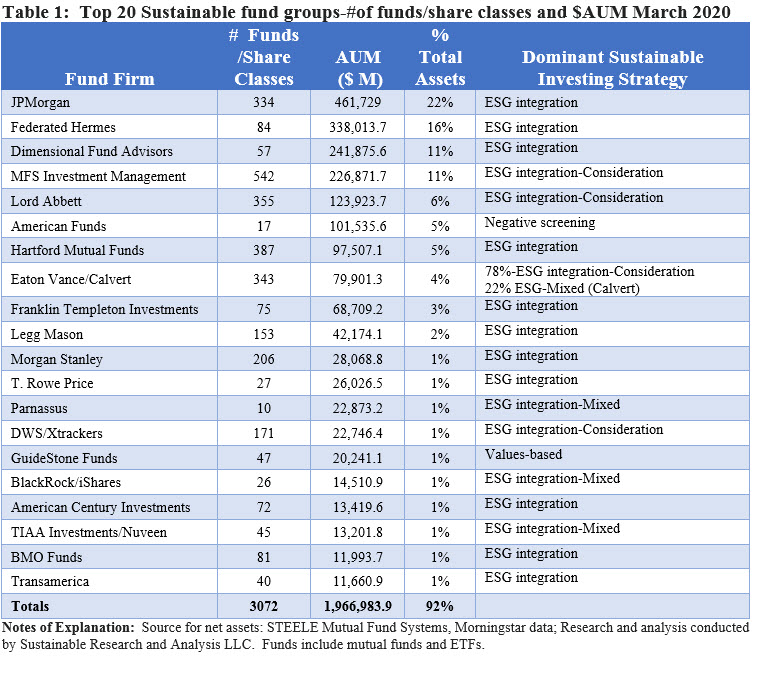
Concentration of sustainable fund assets managed by the top 20 firms, out of a total 179 firms now offering funds in the sphere, ticked up to 92% from 90% last month. Refer to Table 1.
While there was some shifting in the March rankings, the most significant repositioning involved the addition to DFA and American Century into the top ranks. Lifted by its re-brandings, DFA moved up and is now ranked 3rd with 57 fund offerings, $241.9 billion in assets and an 11% share of market. DFA’s sustainable fund offerings is dominated by funds that integrate ESG factors into its investing strategies. For the same reason, American Century also moved up and is now ranked 17th based on sustainable fund assets under management.
ESG integration is the dominant strategy employed by managers ranked among the top 20 fund groups, based on assets under management. That said, some firms manage funds that employ a more varied portfolio of funds, for example BlackRock, however, the combined assets of such funds account for less than 50% of their sustainable funds under management.
ESG integration is further broken down into three categories. ESG-Consideration, an approach adopted by four of the 20 fund firms for some or all sustainable fund offerings, refers to the adoption of prospectus language by which the fund may but is not obligated to account for ESG factors. ESG integration refers to funds that have explicitly committed to account for ESG and typically but not always also combine this with investee engagement. ESG-Mixed refers to fund groups that combine ESG along with companion strategies such as negative screening (exclusions), and/or impact and/or thematic investing. Four fund groups, including Calvert that is a unit of Eaton Vance, fall into this category.
[1] The definition of sustainable investing continues to evolve, but most practitioners agree that this refers to a range of five overarching investing approaches or strategies that encompass values-based investing, negative screening (exclusions), thematic and impact investing, ESG integration, company engagement and proxy voting. These are not mutually exclusive.


