Alternative Investment Funds: A small category that grew rapidly through re-brandings
Alternative sustainable investment funds represent a small category within the sustainable funds universe, comprised of 13 mutual funds (no ETFs), 50 share classes in total offered by 10 firms and managing $9.1 billion in assets of June 2019 largely sourced from institutional investors that make up $8.4 billion or 92% of the category’s assets. The small category, accounting for only 1.2% of the sustainable investment segment’s assets, is also pricier, on average, based on an analysis of expense ratios. The alternatives category has largely evolved through fund re-brandings and the sustainable investing strategies adopted by the various fund offerings is dominated by an ESG integration approach while disclosure practices regarding investment decisions, performance and outcomes, in particular, are limited. This observation, however, is common across sustainable investment funds more generally. The category’s total return performance, qualified on the basis of its sustainable strategies, is short-lived and is therefore too early to evaluate properly. That said, total return results are available for at least 32 funds/share classes out to 5-years given that some of these funds have been in operation as far back as 1989 in the case of Franklin’s Global Currency Fund A shares. Relative to conventional indices such as the S&P 500 and Bloomberg Barclays Aggregate US Index, the performance of these actively managed funds is below benchmark in general.
Growth in alternative sustainable funds segment: Currently at $9.1 billion
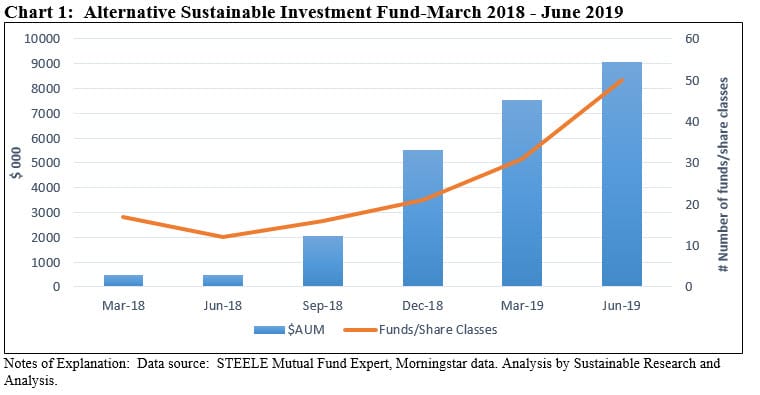
From five funds/17 share classes and $486 million in assets under management at March 2018, the category expanded rapidly starting in the third quarter of the same year and in successive quarters thereafter due largely to fund re-brandings. Net assets expanded 1,768% since the first quarter of 2018, adding an average of $1.7 billion per quarter thereafter but hitting as high as $3.5 billion in a single quarter. Assets increased most dramatically in 4Q 2018 when JPMorgan re-branded the JPMorgan Hedged Equity Fund by formally adopting in its prospectus ESG integration language and shifted $3.5 billion into the category. Having risen to 13 funds at the end of June, the category is expected to decline to 12 funds when the previously announced closing of the Hartford Long/Short Global Equity Fund was scheduled to take effect on or about July 11, 2019. Refer to Chart 1.
The Players: JPMorgan is the largest, offering 4 funds, 19 share classes with $5.2 billion
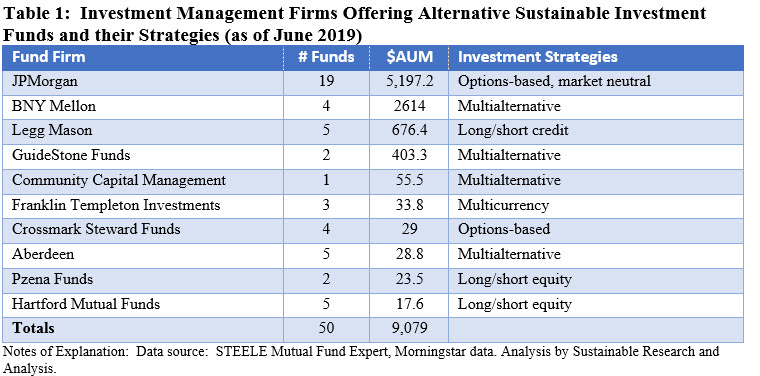
As noted, ten firms as of June 2019 offer alternative sustainable funds, with only one firm, JPMorgan, managing both an options-based strategy and a long/short equity strategy, based on Morningstar’s categories. JPMorgan is also the largest in the segment with $5.2 billion in net assets at the end of June 2019. The next largest at $2.6 billion, is BNY Mellon with its Global Real Return Fund sub-advised by Newton Investment Management (North America) Limited. The smallest firm, Hartford, recently announced the closing of its Hartford Long/Short Global Equity Fund that is managed by Wellington Management. This will reduce to nine the number of investment management companies offering funds in this category starting in 3Q of this year. Refer to Table 1.
The investment profile: options-based strategies make up 57% of net assets
The alternative investment category is comprised of six strategy types including long-short credit, long-short equity, market neutral, multi alternative, multicurrency and options-based strategies. By far the largest category type consists of options-based strategies with $5.2 billion or 57% of the category’s assets while multi alternative strategies account for $3.1 billion or 34% of the segment’s assets. Refer to Table 1.
Sustainable Investing Strategies: ESG integration dominates
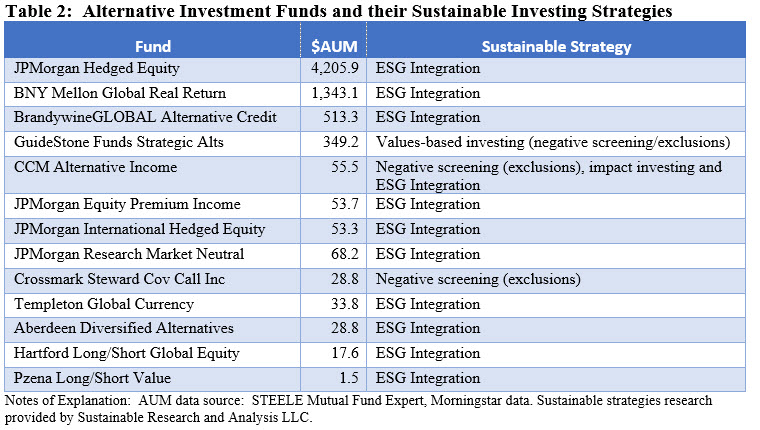
11 of the 13 funds integrate ESG factors into investment decision making. One of these, CCM Alternative Income Institutional Fund, managed by Community Capital, also incorporates negative screening and impact investing.
The remaining two firms include the GuideStone Funds that employ a values-based investing approach using negative screening or exclusions. The second firm, Crossmark Global Investors that manages the Crossmark Steward Covered Call Fund, has adopted an exclusionary approach, although the firm seems to hedge its commitment. According to the Crossmark Steward Covered Call Fund prospectus, the fund “uses its best efforts to avoid investing in companies that are materially involved with mature content, life ethics, alcohol, gambling or tobacco, although it may invest up to 5% of its total assets in certain collective investment vehicles or derivatives that may include prohibited companies.” Refer to Table 2.
Reporting and disclosure: Practices vary considerably
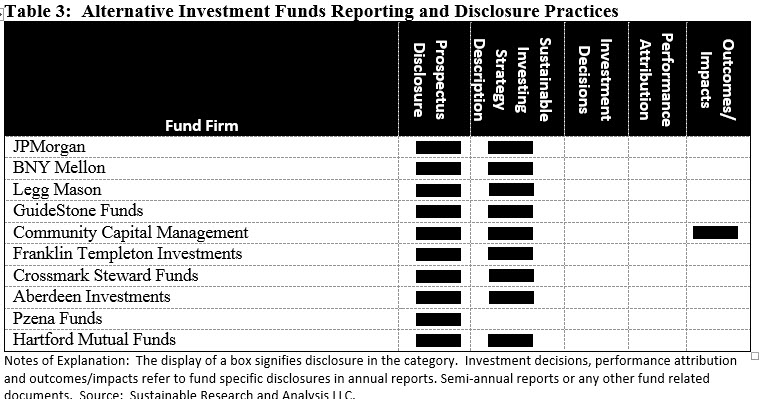
Reporting and disclosure practices vary considerably across the firms and their individual fund offerings. All ten firms do make explicit but limited references to their sustainable investing approach in fund prospectuses and nine of the 10 firms offer supplemental materials. Almost all of these include an extensive library of materials and regularly updated reports that cover the organization’s sustainable investing approach in general. While not mandated, absent are any individual fund specific explanations that offer insights into investment considerations involving stock purchases, sales and retention decisions, particularly affecting controversial companies, performance attribution implications, if any, and outcomes or impacts that may be linked to the fund’s sustainable investment strategies. Such disclosures would inform investors and assist them to more fully understand the investment management firm’s strategy and linkage between financial results and social and environmental outcomes. Refer to Table 3.
At one end of the range, disclosures are limited to the fund prospectus, as is the case with the Pzena’s Long/Short Value Fund which notes that in evaluating an investment for purchase the adviser focuses on the company’s underlying financial condition and business prospects considering estimated earnings, economic conditions, degree of competitive or pricing pressures, the potential impacts of material environmental, social and governance (ESG) factors, and the experience and competence of management, among other factors. The company does not elaborate on its approach in general or in any fund specific literature.
On the other hand, nine firms provide supplemental materials and in some cases an extensive library of regularly updated documents and related reports that are typically posted to the firm’s website. These serve to explain the firm’s approach to sustainable investing in general and how the firm addresses particular topics or issues related to environmental, social and governance factors. The same materials may be somewhat limited, as in the case of the GuideStone Funds Group that practices a values-based investing approach through negative screening (exclusions). Or the documentation may be extensive, as is the case for example, with Franklin Templeton Investments, that go on to explains the firm’s philosophy, process, policies and capabilities and offers commentary and insights covering specific topics, such as renewable energy and climate.
To be clear, these documents are general in nature and offer limited individual fund specific explanations that offer insights into investment considerations involving stock purchases, sales and retention decisions, particularly affecting controversial companies, performance attribution implications, if any, and outcomes. For example, the documentation leaves unresolved how a specific fund in the alternative sphere may consider ESG risks or opportunities when entering into options trades, or making investments in alternative funds or the basis for selecting one mining company over another, to mention just a few.
With regard to security specific references as well as outcomes/impact, one firm, Community Capital Management, publishes an annual impact report that describes the firm’s impact investing approach generally and offers broad-based descriptions of the impacts achieved through the firm’s thematic investing practices across the fund complex. While these, however, are not fund specific disclosures, the Community Capital discloses that it offers investors more specific portfolio and security level tracking and impact reporting using a proprietary technology.
Expense Ratios: Alternative funds are pricier with expense ratios ranging from 0.35% to 4.03%
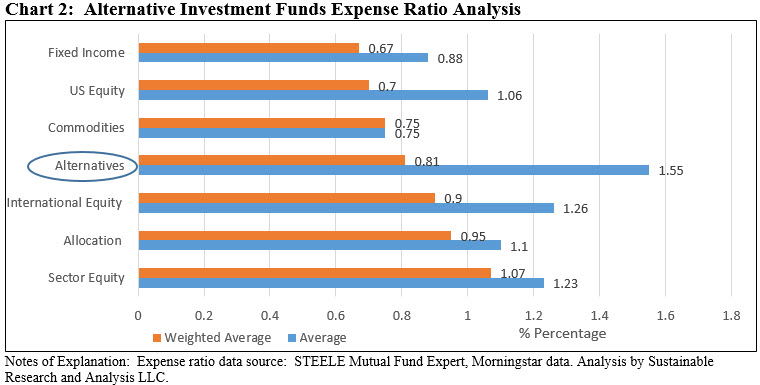
As a category within the sustainable investing segment, the cohort of alternative funds is pricier, with expense ratios for this admittedly small category ranging from a low of 0.35% to a high of 4.03%. At 1.55%, the average expense ratio is the highest within seven sustainable investing categories established for purposes of this analysis. When viewed on an asset-weighted basis, the category at 0.81% falls to the fourth-highest expense category, reflecting the influence of the very large institutionally oriented JPMorgan Hedged Equity share classes offered at 60 bps and 35 bps. Refer to Chart 2.
Fund Performance: Generally below conventional benchmarks
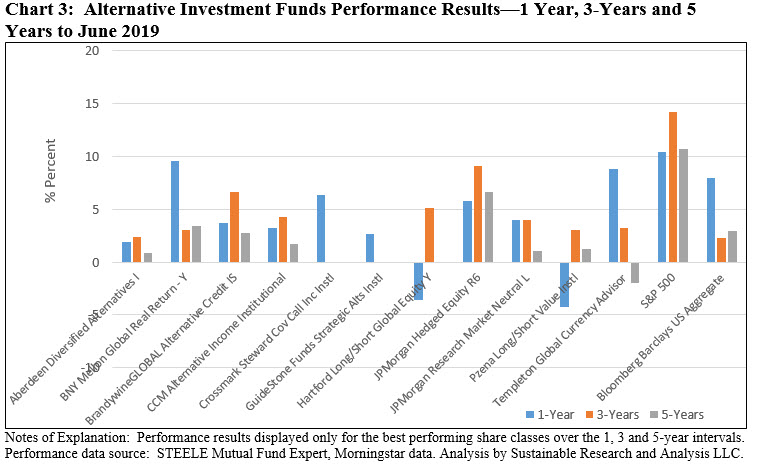
The category’s total return performance, qualified on the basis of sustainable investing strategies, is premature to evaluate due to the recent re-brandings of many funds in the category and, in the case of JPMorgan’s Equity Premium Income and International Hedged Equity funds, their more recent launches in 2018 and 2019. That said, the total returns for the previous 1, 3 and 5-year intervals, evaluated relative to conventional indices such as the S&P 500 and Bloomberg Barclays Aggregate US Index, point to below benchmark results in general. None of the funds/share classes outperformed the S&P 500 over the one-year, three-year and five-year intervals. Relative to the conventional bond index, only 5 funds/share classes, or 12.5%, outperformed during the one year-interval, 28 of 32 funds/share classes, or 87.5% outperformed over the three-year interval and only five of 28 funds/share classes or 17.9% outperformed across the five-year interval. Excluded are the 3 funds with a ten-year track record. Refer to Chart 4.
