The Bottom Line: Markets ended lower for the second consecutive month in October while sustainable indices turn in mixed results relative to their conventional counterparts.
Markets ended lower for the second consecutive month in October
Even as economic data and corporate earnings posted improvements in October, markets ended lower for the second consecutive month as increasing coronavirus infections that surpassed the highest levels reached in the US in August and elsewhere contributed to fears of another series of lockdowns. The broad market, as measured by the S&P 500, gave up -2.66% while the S&P 500 ESG Index ended 7 bps lower at -2.77%. The DJIA was down -4.51% while the NASDAQ Composite dropped -2.3%. On the other hand, mid cap and small cap stocks posted gains of 2.2% and 2.6% as investors sought bargains, but these results were not enough to offset the previous month’s declines. Value stocks performed even better, outshining their growth-oriented counterparts across the range of market capitalizations.
Except for high yield bonds, fixed income securities moved lower
Except for high yield bonds that posted positive returns in the 0.2% to 0.5% range, fixed income securities ended lower. The Bloomberg Barclays US Aggregate Bond Index gave up -0.5% while US Treasuries recorded an average drop of -0.9%. Declines, however, ranged from 0.0% for 1-3 year Treasuries while 20+ year Treasuries registered a decline of -3.1%.
Outside the US emerging markets gained while global and international markets posted declines
Outside the US, the MSCI ACWI ex USA was lower by -2.1% while the MSCI EAFE Index closed even lower with a -4.0% total return. At the same time, emerging markets posted a gain of 2.1%. In a reversal, however, growth stocks largely outperformed value stocks. Eastern Europe was the worst performing international region, down -9.2%, while results across individual countries in both developed and developing countries ranged from a high of 5.3% registered by China to a low of -10.2% recorded by Germany.
Sustainable[1] indices turn in mixed results relative to their conventional counterparts
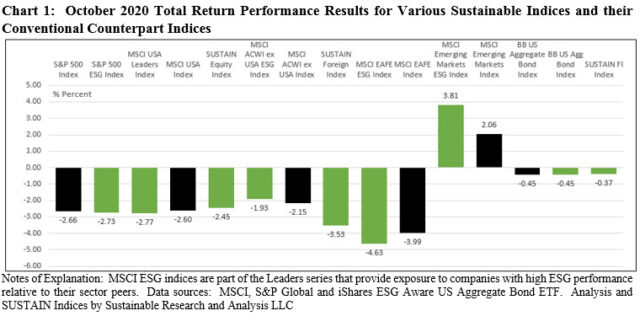
Two leading US stock market tracking ESG indices, namely the S&P 500 ESG Index and the MSCI USA ESG Leaders Index, both lagged behind their conventional counterparts by 7 bps and 17 bps, respectively. Refer to Chart 1. While the relative performance drag can also observed in connection with the MSCI USA ESG Leaders Index over the one, three and five-year intervals, this is not the case for the S&P 500 ESG Index which, beyond one-month, maintains its longer-term outperformance. That said, the three year returns and beyond for the S&P 500 ESG Index are derived through back casting as the index was launched as of January 28, 2019.
Of three leading global and international indices, the MSCI ACWI ex USA ESG Leaders Index and the MSCI Emerging Markets ESG Leaders Index, emphasizing companies with high ESG ratings relative to their peers, outperformed their conventional counterparts with margins of 22 bps and 175 bps, respectively. The ESG indices also continue to eclipse their non-ESG equivalents longer-term. An exception is the MSCI EAFE ESG Leaders Index that dropped -4.63% while its MSCI EAFE conventional counterpart declined -3.99% for a negative differential of 64 bps.
At the same time, the Bloomberg Barclays MSCI US Aggregate Bond Index, down -0.45% in October, performed in line with the non-ESG intermediate investment-grade counterpart, the Bloomberg Barclays US Aggregate Bond Index. For the trailing twelve month period, the ESG index outperformed by 18 bps.
Three ESG mutual fund indices tracked by Sustainable Research and Analysis turned in mixed results with equity and fixed income funds outperforming while the average performance of foreign funds lagged.

The Sustainable (SUSTAIN) Large Cap Equity Fund Index beat the conventional S&P 500 benchmark in October by 21 bps
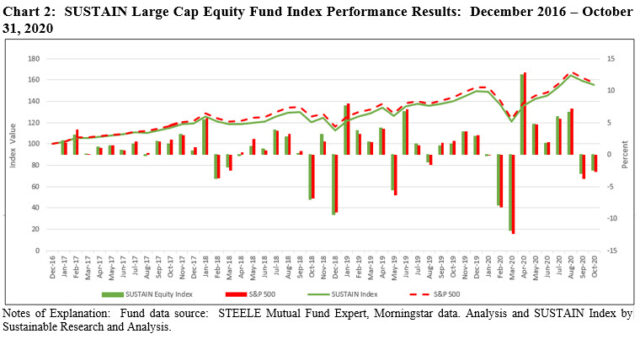
For the second consecutive month, the Sustainable (SUSTAIN) Large Cap Equity Fund Index posted negative results but again outperformed the conventional S&P 500 Index. The -2.45% decline registered by the SUSTAIN Index in October beat the -2.66% recorded by the S&P 500 as it benefited from the excess performance achieved by seven of the ten funds that comprise the Index. The SUSTAIN Index, which is now down -5.4% over the latest two-month interval, also continued to lead the S&P 500 over the trailing 3-month, year-to-date and 12-month periods. Refer to Chart 2.
Leading the pack in October is the Neuberger Berman Sustainable Equity Fund Institutional shares, down -0.60%, while lagging funds included the Hartford Capital Appreciation A, Pioneer A and GMO Quality III that were down -3.13%, -3.43% and -3.65%, respectively.

The Sustainable (SUSTAIN) Bond Fund Index reversed course again this month but to the negative, recording a -0.37% total return that eclipsed the conventional yardstick by 8 bps
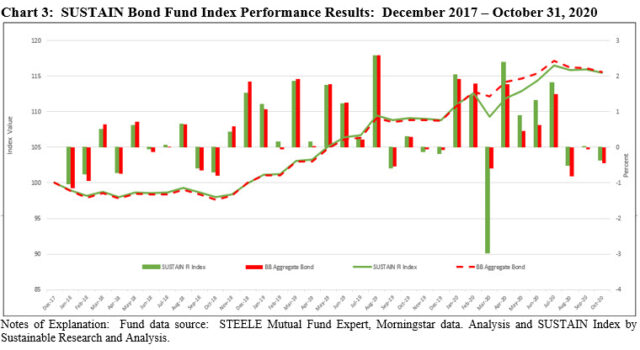
The Sustainable (SUSTAIN) Bond Fund Index reversed course again in October and registered a decline of -0.37% but still managed to outperform the -0.45% recorded by the Bloomberg Barclays US Aggregate Bond Index, for a positive margin of 8 bps. The SUSTAIN Bond Fund Index, which posted its third decline so far this year, is up 6.13% year-to-date. This put the index ahead of the S&P 500 (2.77%) as well as the SUSTAIN Equity Fund Index (4.08%). Refer to Chart 3.
Nine of the 10 sustainable bond funds that comprise the index outperformed in October, with returns that ranged from -0.26% posted by BMO Core Plus Bond Fund I to -0.49% registered by Pax Core Bond Fund I.
The SUSTAIN Bond Fund Index was also ahead over the trailing 3-months, but lags the conventional Bloomberg Barclays US Aggregate Bond Index on a year-to-date and trailing 12-month-basis by 19 bps and 37 bps, in that order.

The Sustainable (SUSTAIN) Foreign Fund Index gave up -3.53% and trailed the MSCI ACWI ex USA Index by a wide 1.4%
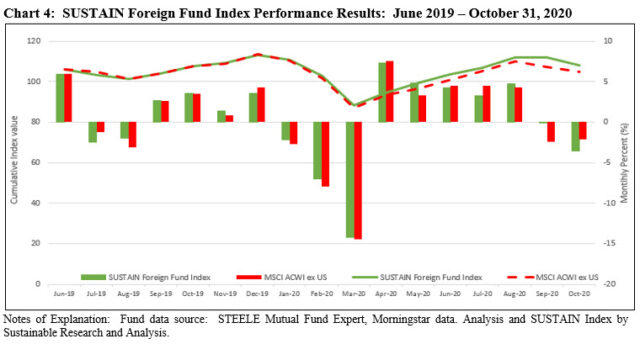
After last month’s posting of the widest positive level of outperformance since the inception of the SUSTAIN Foreign Fund Index as of December 2017, the SUSTAIN Foreign Fund Index recorded its widest negative differential relative to the MSCI ACWI ex USA Index as the two benchmarks registered returns that were 1.4% apart. The SUSTAIN benchmark’s -3.53% return in October was the steepest decline since March and it was off by 1.4% relative to the conventional benchmark. Only two of the ten funds in the index outperformed, including the Hartford International Opportunities Fund Y at -1.02% and the UBS International Sustainable Equity Fund P that recorded a decline of -1.76%. At the other end of the range, the Morgan Stanley International Institutional Equity Fund I was down -6.12%. Refer to Chart 4.
Still, August’s strong 4.7% gain helped propel the SUSTAIN Index to a positive 1.01% return for the trailing 3-months. Further, the SUSTAIN Index continues to outperform the conventional benchmark over the year-to-date and trailing 12-month intervals.

[1] While definitions continue to evolve, sustainable investing refers to a range of five overarching investing approaches or strategies that encompass: values-based investing, negative screening (exclusions), thematic and impact investing and ESG integration. Shareholder and bondholder engagement and proxy voting may also be employed along with one of more of these strategies that are not mutually exclusive.
Sustainable indices turn in mixed results in October
The Bottom Line: Markets ended lower for the second consecutive month in October while sustainable indices turn in mixed results relative to their conventional counterparts.
Share This Article:
The Bottom Line: Markets ended lower for the second consecutive month in October while sustainable indices turn in mixed results relative to their conventional counterparts.
Markets ended lower for the second consecutive month in October
Even as economic data and corporate earnings posted improvements in October, markets ended lower for the second consecutive month as increasing coronavirus infections that surpassed the highest levels reached in the US in August and elsewhere contributed to fears of another series of lockdowns. The broad market, as measured by the S&P 500, gave up -2.66% while the S&P 500 ESG Index ended 7 bps lower at -2.77%. The DJIA was down -4.51% while the NASDAQ Composite dropped -2.3%. On the other hand, mid cap and small cap stocks posted gains of 2.2% and 2.6% as investors sought bargains, but these results were not enough to offset the previous month’s declines. Value stocks performed even better, outshining their growth-oriented counterparts across the range of market capitalizations.
Except for high yield bonds, fixed income securities moved lower
Except for high yield bonds that posted positive returns in the 0.2% to 0.5% range, fixed income securities ended lower. The Bloomberg Barclays US Aggregate Bond Index gave up -0.5% while US Treasuries recorded an average drop of -0.9%. Declines, however, ranged from 0.0% for 1-3 year Treasuries while 20+ year Treasuries registered a decline of -3.1%.
Outside the US emerging markets gained while global and international markets posted declines
Outside the US, the MSCI ACWI ex USA was lower by -2.1% while the MSCI EAFE Index closed even lower with a -4.0% total return. At the same time, emerging markets posted a gain of 2.1%. In a reversal, however, growth stocks largely outperformed value stocks. Eastern Europe was the worst performing international region, down -9.2%, while results across individual countries in both developed and developing countries ranged from a high of 5.3% registered by China to a low of -10.2% recorded by Germany.
Sustainable[1] indices turn in mixed results relative to their conventional counterparts
Two leading US stock market tracking ESG indices, namely the S&P 500 ESG Index and the MSCI USA ESG Leaders Index, both lagged behind their conventional counterparts by 7 bps and 17 bps, respectively. Refer to Chart 1. While the relative performance drag can also observed in connection with the MSCI USA ESG Leaders Index over the one, three and five-year intervals, this is not the case for the S&P 500 ESG Index which, beyond one-month, maintains its longer-term outperformance. That said, the three year returns and beyond for the S&P 500 ESG Index are derived through back casting as the index was launched as of January 28, 2019.
Of three leading global and international indices, the MSCI ACWI ex USA ESG Leaders Index and the MSCI Emerging Markets ESG Leaders Index, emphasizing companies with high ESG ratings relative to their peers, outperformed their conventional counterparts with margins of 22 bps and 175 bps, respectively. The ESG indices also continue to eclipse their non-ESG equivalents longer-term. An exception is the MSCI EAFE ESG Leaders Index that dropped -4.63% while its MSCI EAFE conventional counterpart declined -3.99% for a negative differential of 64 bps.
At the same time, the Bloomberg Barclays MSCI US Aggregate Bond Index, down -0.45% in October, performed in line with the non-ESG intermediate investment-grade counterpart, the Bloomberg Barclays US Aggregate Bond Index. For the trailing twelve month period, the ESG index outperformed by 18 bps.
Three ESG mutual fund indices tracked by Sustainable Research and Analysis turned in mixed results with equity and fixed income funds outperforming while the average performance of foreign funds lagged.
The Sustainable (SUSTAIN) Large Cap Equity Fund Index beat the conventional S&P 500 benchmark in October by 21 bps
For the second consecutive month, the Sustainable (SUSTAIN) Large Cap Equity Fund Index posted negative results but again outperformed the conventional S&P 500 Index. The -2.45% decline registered by the SUSTAIN Index in October beat the -2.66% recorded by the S&P 500 as it benefited from the excess performance achieved by seven of the ten funds that comprise the Index. The SUSTAIN Index, which is now down -5.4% over the latest two-month interval, also continued to lead the S&P 500 over the trailing 3-month, year-to-date and 12-month periods. Refer to Chart 2.
Leading the pack in October is the Neuberger Berman Sustainable Equity Fund Institutional shares, down -0.60%, while lagging funds included the Hartford Capital Appreciation A, Pioneer A and GMO Quality III that were down -3.13%, -3.43% and -3.65%, respectively.
The Sustainable (SUSTAIN) Bond Fund Index reversed course again this month but to the negative, recording a -0.37% total return that eclipsed the conventional yardstick by 8 bps
The Sustainable (SUSTAIN) Bond Fund Index reversed course again in October and registered a decline of -0.37% but still managed to outperform the -0.45% recorded by the Bloomberg Barclays US Aggregate Bond Index, for a positive margin of 8 bps. The SUSTAIN Bond Fund Index, which posted its third decline so far this year, is up 6.13% year-to-date. This put the index ahead of the S&P 500 (2.77%) as well as the SUSTAIN Equity Fund Index (4.08%). Refer to Chart 3.
Nine of the 10 sustainable bond funds that comprise the index outperformed in October, with returns that ranged from -0.26% posted by BMO Core Plus Bond Fund I to -0.49% registered by Pax Core Bond Fund I.
The SUSTAIN Bond Fund Index was also ahead over the trailing 3-months, but lags the conventional Bloomberg Barclays US Aggregate Bond Index on a year-to-date and trailing 12-month-basis by 19 bps and 37 bps, in that order.
The Sustainable (SUSTAIN) Foreign Fund Index gave up -3.53% and trailed the MSCI ACWI ex USA Index by a wide 1.4%
After last month’s posting of the widest positive level of outperformance since the inception of the SUSTAIN Foreign Fund Index as of December 2017, the SUSTAIN Foreign Fund Index recorded its widest negative differential relative to the MSCI ACWI ex USA Index as the two benchmarks registered returns that were 1.4% apart. The SUSTAIN benchmark’s -3.53% return in October was the steepest decline since March and it was off by 1.4% relative to the conventional benchmark. Only two of the ten funds in the index outperformed, including the Hartford International Opportunities Fund Y at -1.02% and the UBS International Sustainable Equity Fund P that recorded a decline of -1.76%. At the other end of the range, the Morgan Stanley International Institutional Equity Fund I was down -6.12%. Refer to Chart 4.
Still, August’s strong 4.7% gain helped propel the SUSTAIN Index to a positive 1.01% return for the trailing 3-months. Further, the SUSTAIN Index continues to outperform the conventional benchmark over the year-to-date and trailing 12-month intervals.
[1] While definitions continue to evolve, sustainable investing refers to a range of five overarching investing approaches or strategies that encompass: values-based investing, negative screening (exclusions), thematic and impact investing and ESG integration. Shareholder and bondholder engagement and proxy voting may also be employed along with one of more of these strategies that are not mutually exclusive.
Sustainableinvest.com
Benefits
Free access to regularly updated original research and analysis focused exclusively on sustainable finance and investing, providing investors with the guidance needed to make informed investment decisions that align with their personal values and financial goals while also contributing to the advancement of positive long-term environmental and social outcomes.
By offering financial support for our current work, either in the form of a one-time or regular contributions, you help to defray some of the costs associated with conducting our research and analysis as well as to maintain the www.sustainableinvest.com website.
Helping us to expand our research capabilities and offerings over time to cover additional relevant topics geared to sustainable investors.
Sign up to free newsletters.
By submitting this form, you are consenting to receive marketing emails from: . You can revoke your consent to receive emails at any time by using the SafeUnsubscribe® link, found at the bottom of every email. Emails are serviced by Constant Contact