The Bottom Line: Focused long-term sustainable funds gained $6.7 billion in net assets but experienced outflows, no fund launches were recorded, while ESG indices trailed.
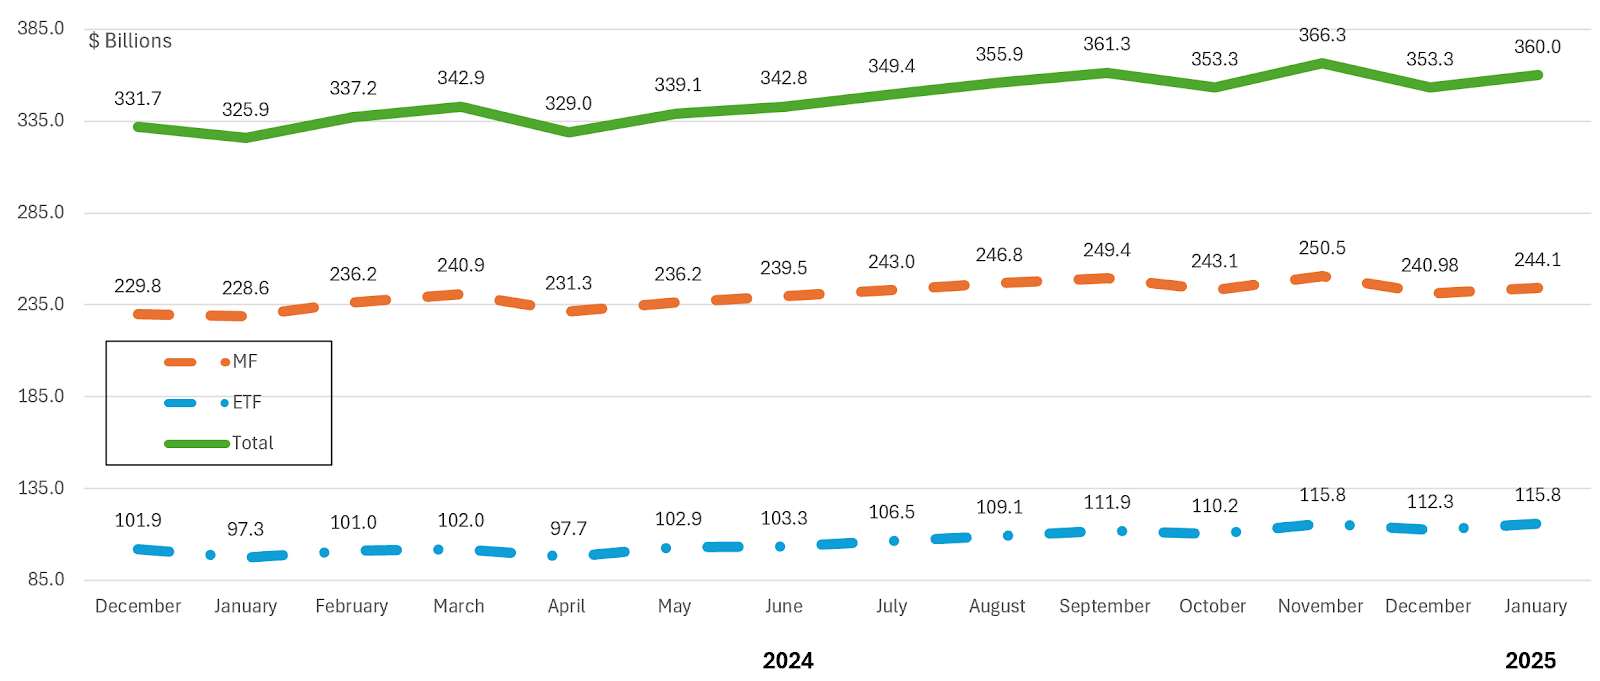
Long-Term Net Assets: Focused Sustainable Mutual Funds and ETFs |
Focused sustainable long-term fund assets under management attributable to mutual funds and ETFs (excluding money market funds), a combined total of 1,380 funds/share classes as well as ETFs, (1,153 mutual funds/share classes and 227 ETFs), based on Morningstar classifications, closed the month of January with $360 billion in net assets. This represents a gain of $6.7 billion in net assets, or 1.9%, during a month when long-term funds posted a total return gain of 2.42%. Mutual funds gained $3.14 billion for a month over month increase of 1.3% while ETFs added $3.55 billion, registering a net gain of 3.2%. Using a simple back of an envelope calculation, focused sustainable funds experienced outflows in January. Mutual funds gave up around $2.1 billion while ETFs experienced net inflows in the amount of $0.78 million. |
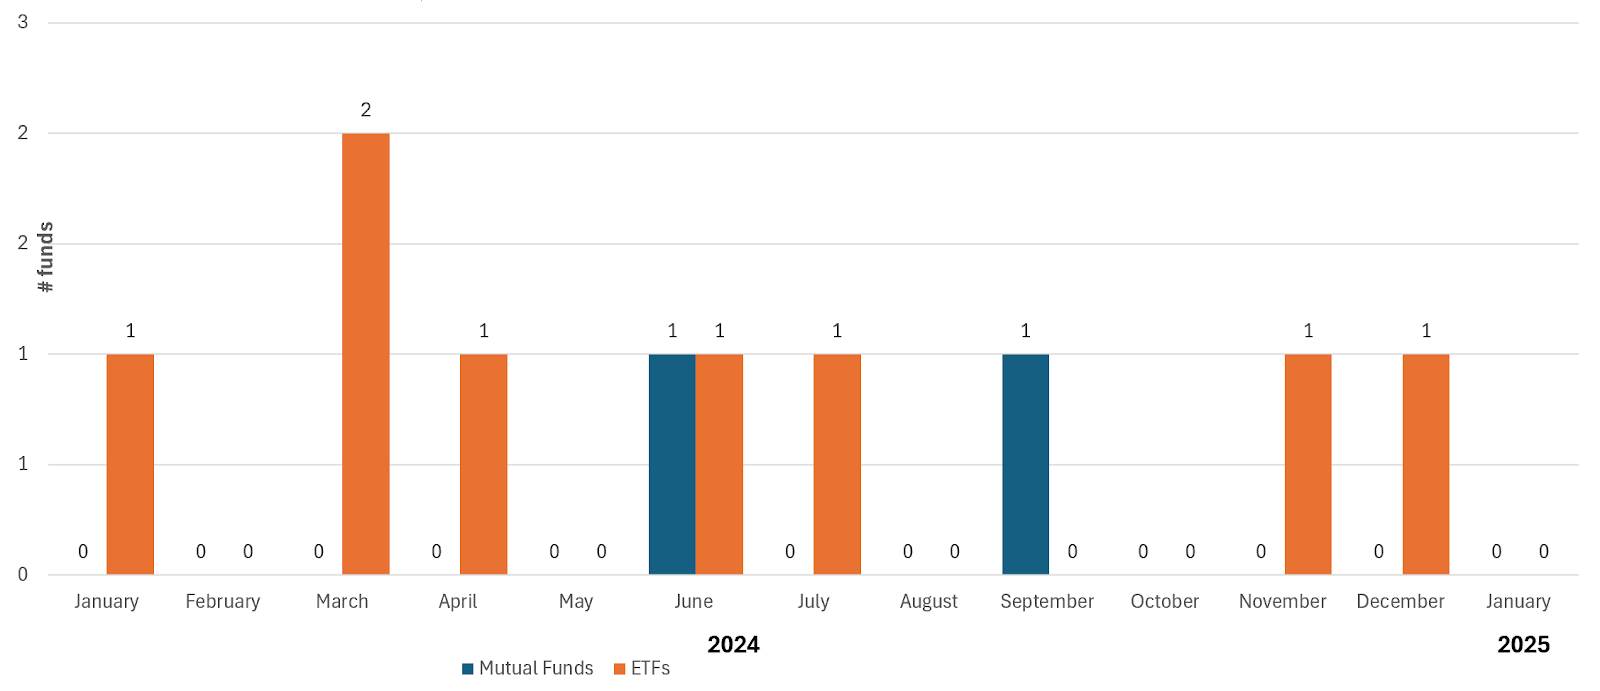
New Sustainable Fund Launches |
There were no new listings of focused sustainable mutual funds or ETFs during the month of January. This continues a drought affecting new sustainable fund listings that started after May of 2023. At the same time, two ETFs were delisted in January, including the $10.6 million Goldman Sachs Bloomberg Clean Energy Equity ETF (GCLN) and the $15.2 million Goldman Sachs FT Real Estate and Infrastructure Equity ETF (GREI). This follows a year during which there 40 fund delistings, the highest number in a five-year interval. |
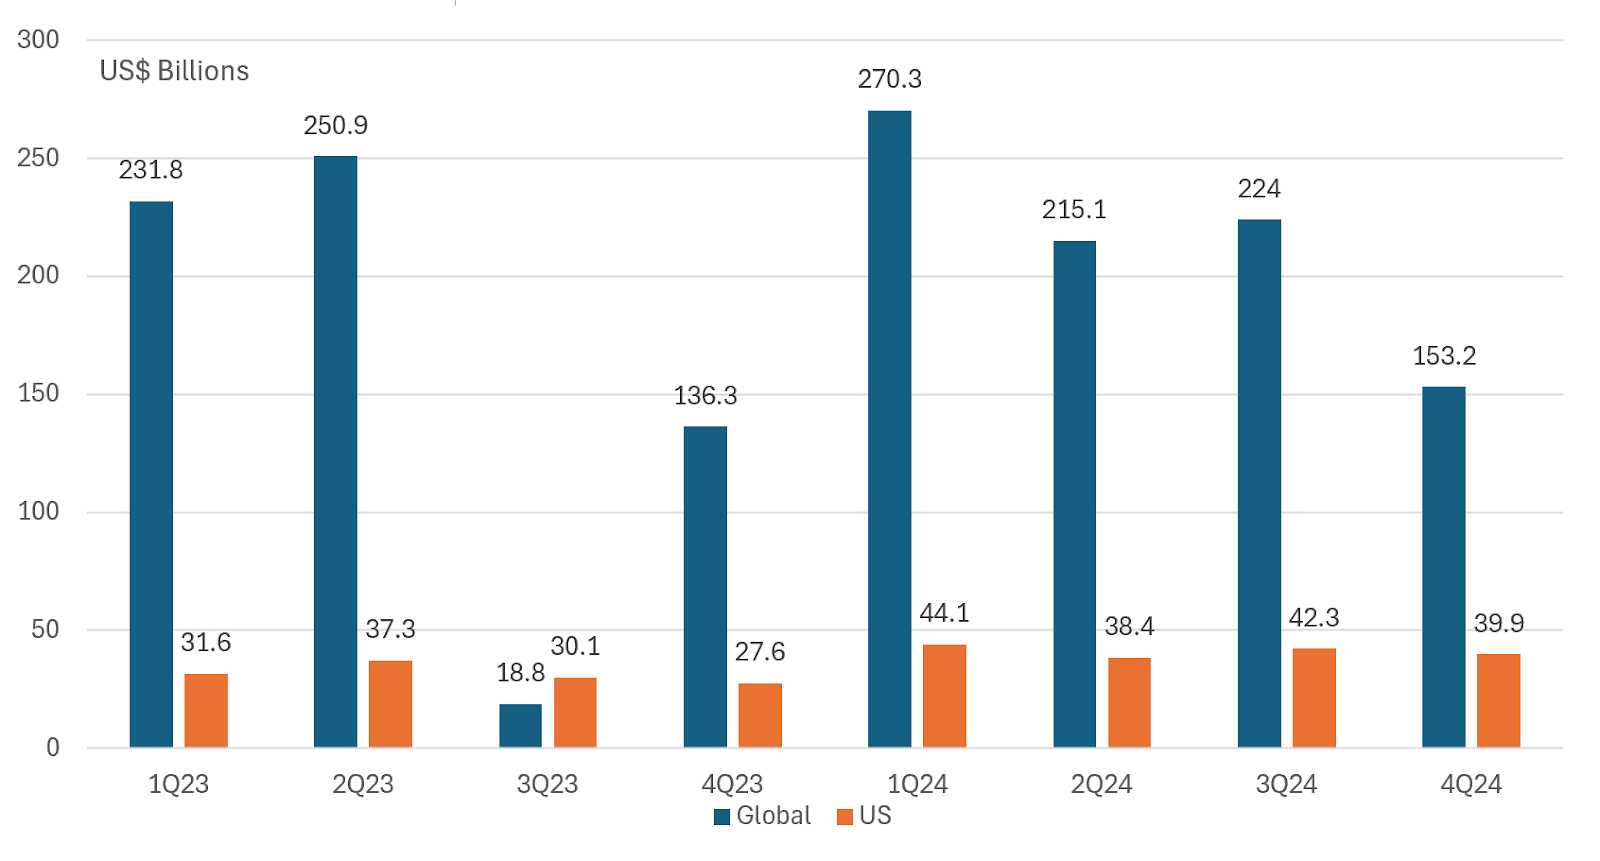
Green, Social and Sustainability Bonds Issuance (to Q4 2024) |
According to SIFMA, global green, social and sustainable bond issuance in 2024 reached $826 billion, based on slightly adjusted issuance numbers. This represents an increase of $83.8 million, or 10.9%, relative to 2023. Issuance declined in Q4, dropping from $224 billion to $153.2 billion, for a Q/Q decline of 31.6%. In the US, volumes also dropped in Q4, but the decline was less dramatic. Q4 volume came in at $39.9 billion versus $42.3 billion in Q3, or a 5.9% drop. That said, the year ended in the US, according to SIFMA which relies on data from Dealogic, at $164.7 billion versus $126.6 billion in 2023, or an increase of 30.1%. It should be noted that this level of US issuance exceeds the levels attributable to the US by other data providers. It should also be noted that other data sources, for example Bloomberg as well as Environmental Finance, both reported that global sustainable bond sales exceeded $1 trillion in 2024 and scored the second highest level of issuance after 2021. One reason for the variance is the inclusion by these two organizations of sustainability-linked notes and transition bonds that add a combined total of $55.5 billion in issuance. But more importantly is the variance in the tally for green, social and sustainability bonds that amount to almost $989 billion, according to Environmental Finance, versus $826 billion and a variance of $162.9 billion according to SIFMA. |
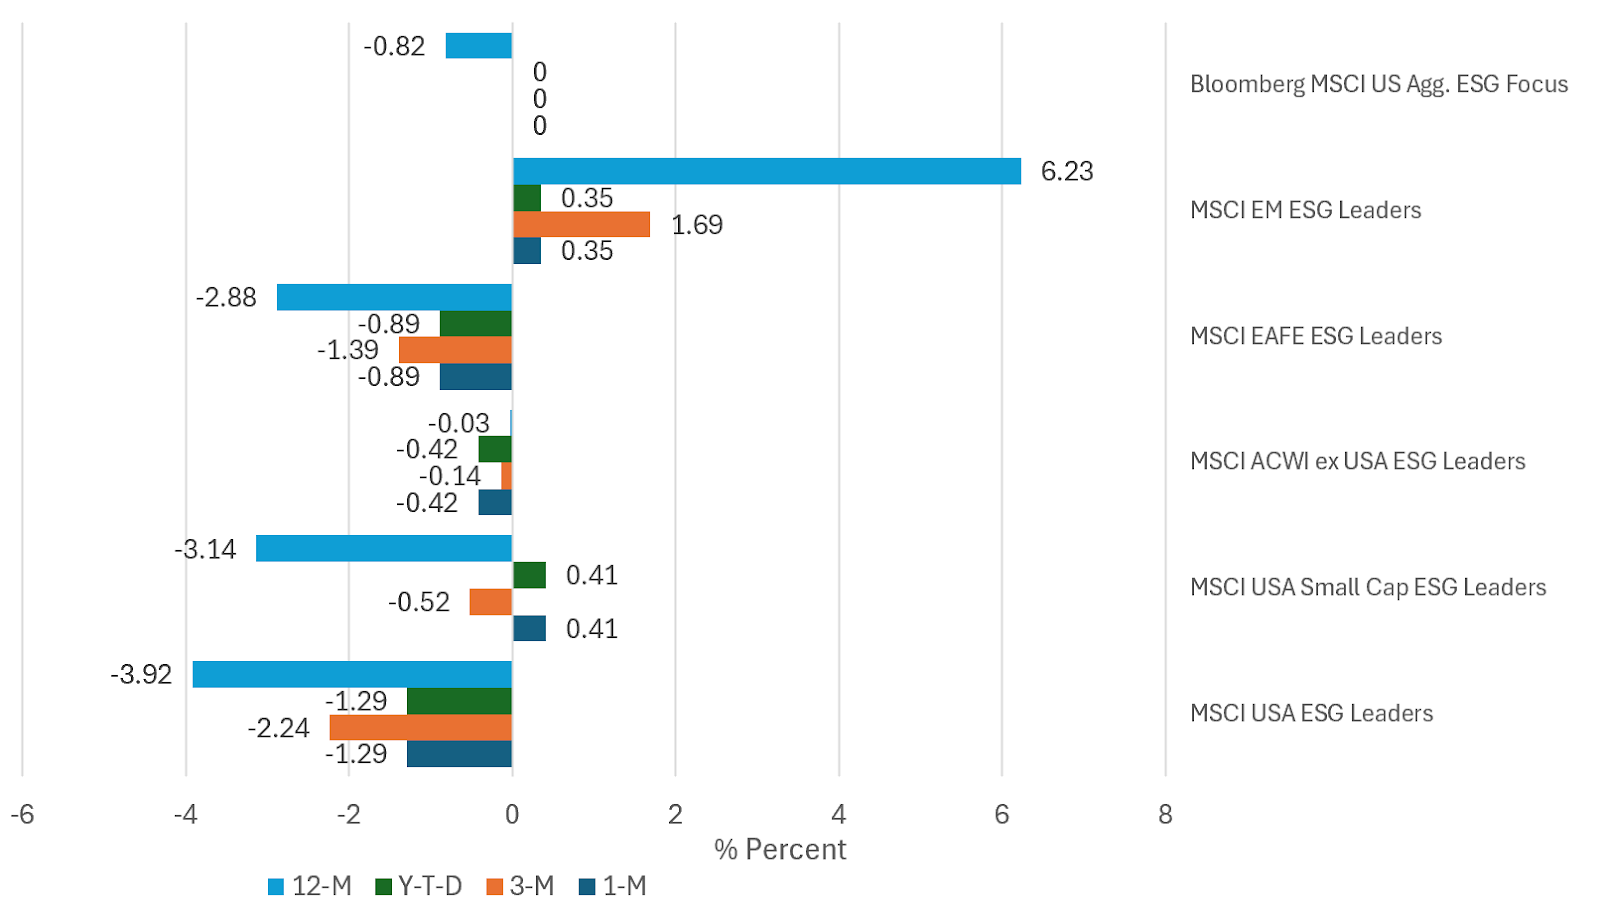
Short-Term Relative Performance: Selected ESG Indices vs. Conventional Indices |
Short-term results: Based on a selection of five US and international equity ESG Leaders indices and one fixed income benchmark, for a total of six benchmarks constructed by MSCI around ESG screening and exclusionary criteria, two indices outperformed their conventional counterparts in January, three indices underperformed while one index matched its conventional counterpart. Outperforming sustainable indices included the MSCI US Small Cap ESG Leaders Index and the MSCI Emerging Markets ESG Leaders Index that outperformed in January by 41 bps and 35 bps, respectively. For the trailing one-year interval only one ESG index outperformed, namely the MSCI Emerging Markets Leaders Index that pulled ahead by a wide 6.23%. In part, the index benefited from higher exposures to Taiwan and a lower exposure to South Korea as well as greater weightings, almost 2X the weightings, in stocks like Taiwan Semiconductor and Tencent Holdings. Intermediate-to-long-term results: Over the intermediate and long-term, the relative performance results posted by the same ESG indices through the end of January are disappointing. The MSCI Emerging Markets ESG Leaders Index is the only benchmark to outperform over the ten- and five-year intervals to January 2025 with average annual beats of 73 bps and 14 bps, respectively. That said, the index trails over the training 3-year period. The other four equity benchmarks underperformed over the 3, 5 and 10-year intervals. While it has not yet established a 10-year track record, the Bloomberg MSCI US Aggregate ESG Focused Index tracked its underlying benchmark very closely over the three- and five-year intervals. It should be said, however, that the ten 10-year track record attributed to ESG indices is subject to interpretation in the light of significant operational and definitional changes over that time interval. 3-year and 5-year proxies may be better indicators. |
Sources: Morningstar Direct, MSCI, SIFMA/Dealogic, and Sustainable Research and Analysis LLC