The Bottom Line: Focused sustainable funds ended 2024 with $353.3 billion in assets, still off their high, due, in part, to outflows and listings drought.
Long-Term Net Assets: Sustainable Mutual Funds and ETFs |
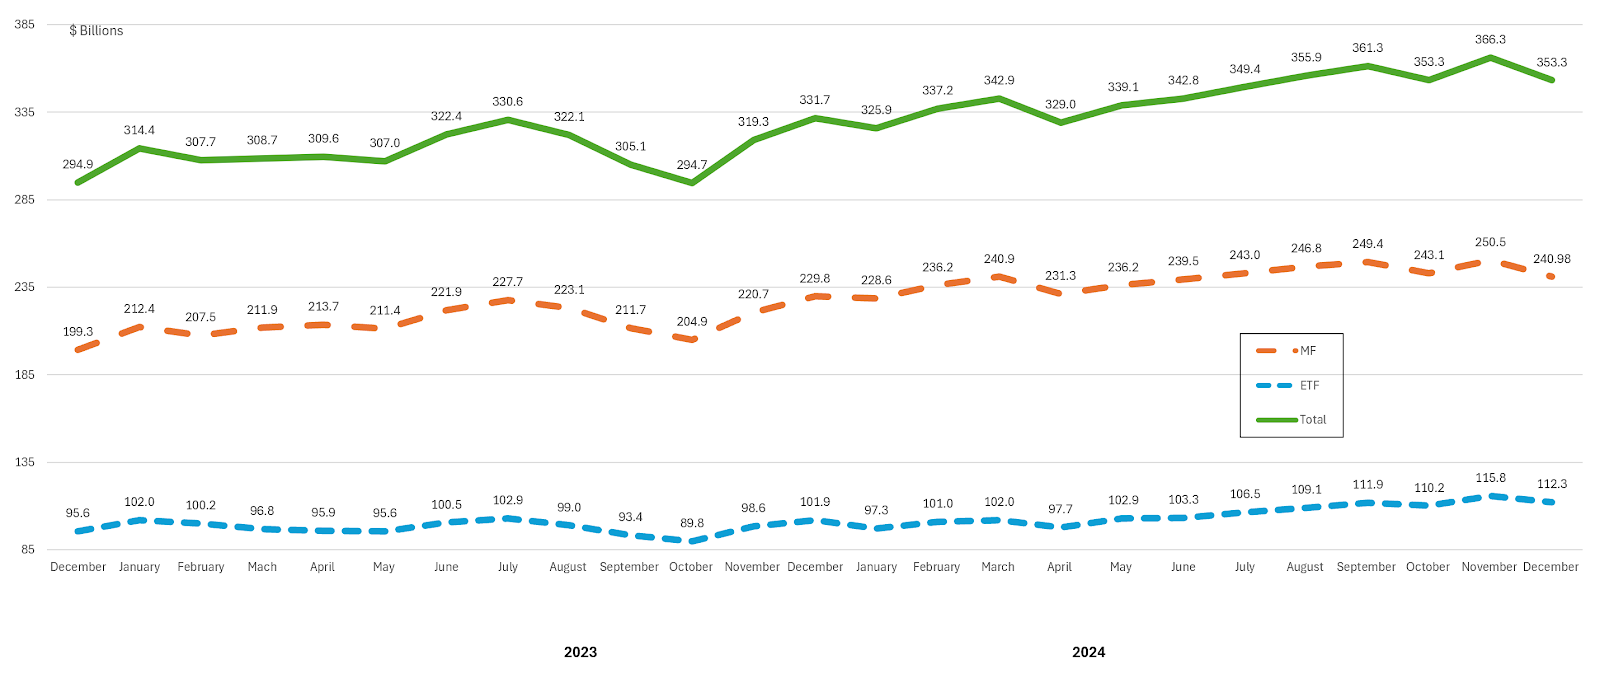
Focused sustainable long-term fund assets under management attributable to mutual funds and ETFs (excluding money market funds), a combined total of 1,383 funds/share classes as well as ETFs, (1,152 mutual funds/share classes and 231 ETFs), based on Morningstar classifications, closed the month of December and year-end 2024 with $353.3 billion in net assets. In December, the assets of focused long-term sustainable funds declined by $13.07 billion, from $366.3 billion at the end of November, for a drop of 3.6%. For the year, long-term funds benefited from the strong stock market performance (more than 77% of sustainable fund assets are invested in equity funds) and added $21.6 billion in net assets, an increase of 7%. The year-end level of $353.3 billion, however, is still short of the high level reached at the end of 2021, prior to the severe 2022 decline in the capital markets when long-term focused sustainable fund assets stood at $373.4 billion. At the same time, the net assets gain lags the 8.6% average return (13.4% on an average asset weighted basis) posted by focused sustainable long-term funds in 2024, thus pointing to net outflows that, based on a simple calculation and using average returns, are estimated to have reached $6.9 billion in 2024. The net assets of long-term mutual funds ended 2024 with $241 billion, having gained $11.2 billion or 5% for the year. That said, mutual funds experienced net outflows estimated at $6.9 billion. On other hand, the net assets of focused sustainable ETFs recorded an increase of $10.4 billion, or 10%, while also contributing positively to flows with an estimated $3.7 billion in inflows. Stock funds, both domestic and international, continue to dominate the focused sustainable funds space, with $290.1 billion in net assets, up 7% year-over year. At the same time, fixed income funds ended the year with $49.5 billion in net assets and a gain of $2.8 billion, or 6%. Both asset classes experienced a decline in the number of funds offered, due to fund closures and other forms of reorganization. |
New Sustainable Fund Launches |
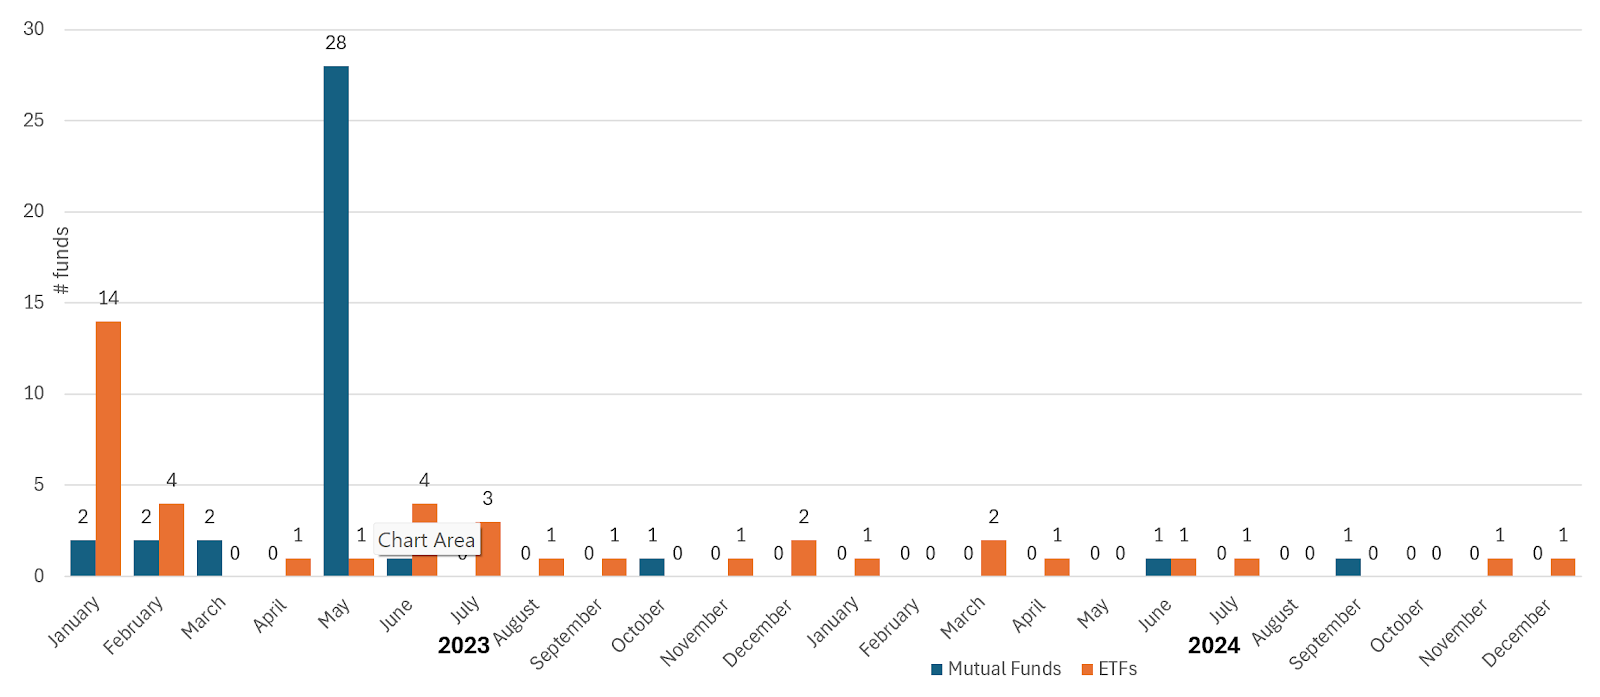
The drought affecting new listings of focused sustainable funds, which started after May of 2023, continued into December 2024. There were no new mutual fund listings in December and only one new sustainable ETF was launched during the last month of the year. The new fund listed in December is the passively managed $2.3 billion Invesco MSCI North American Climate ETF (KLMN). At $2.3 billion, it is also the largest ETF listing in 2024. During the calendar year 2024, new listings were limited to a combined total of nine mutual funds and ETFs. Seven of these include new ETF listings (excluding funds that switched from one listing exchange to another), both active and passively managed investment vehicles, as well as two new mutual fund listings (excluding new share classes). This compares to 68 new fund listings in 2023, including 32 ETFs and 36 mutual funds. The scarcity in sustainable fund launches, starting after May of 2023, may be attributable to the fact that anti-ESG movement in the US had gained momentum in the second quarter of 2023 and fund companies may have opted to lower their profile, including curtailing focused fund offerings, while at the same time continuing to support sustainable investing practices. Sustainability remains important to institutional investors who led in the recovery of assets since 2022, and it also remains important to corporate executives as well as asset owners. Retail investors, on the other hand, are still struggling to recover fully from the declines suffered in 2022 due to withdrawals and capital depreciation but their flows exhibited improving interest in sustainable investing last year. One of the latest surveys on this topic was recently published by The Capital Group. The Capital Group ESG Global Study was commissioned for a fourth year to gather the views of 1,130 global investors on ESG investing via an online survey conducted by CoreData Research during May and June 2024. “This year’s study shows global ESG adoption remains at an all-time high. Nine in 10 (90%) investors in the study identify as ESG users — the same as last year. This illustrates ongoing strong conviction in ESG as it enters a more mature phase of growth following its rapid evolution from niche to mainstream. EMEA is the leader, with 94% of respondents adopting ESG — up one percentage point from last year. ESG adoption rates in Asia-Pacific (93%) and North America (75%) are unchanged from last year.” |
Green, Social and Sustainability Bonds Issuance (to Q3 2024) |
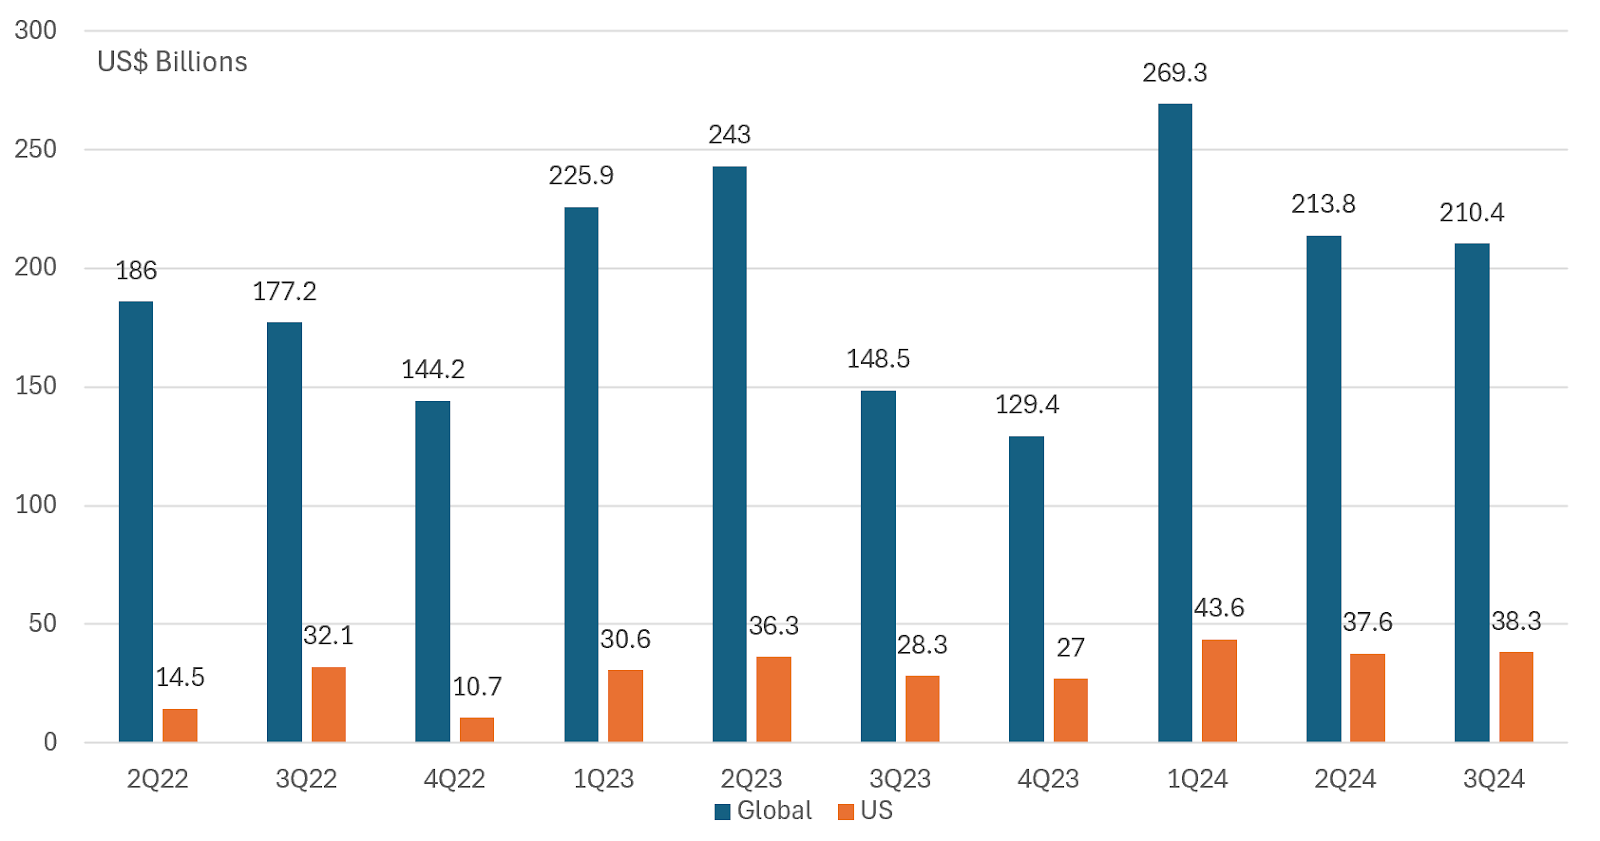
YE 2024: Based on early reporting by Bloomberg, global sustainable bonds issuance in 2024 likely reached $1.0 trillion, with 4,490 offerings that exceeded the previous high of 3,729 issues registered the previous year. If confirmed, 2024 will be the second year only during which sustainable bond issuance exceeded $1 trillion. Only during 2021 did sustainable bond issuance reach a high level of $1.1 trillion. Last year’s issuance of green, social, sustainability and sustainability-linked bonds was 10% above 2023 levels, with record sales recorded by both green and sustainability bonds. The only category of sustainable bonds to post a decline last year was sustainability-linked bonds that dropped for the third year in a row and posted a year-over-year decline of 38.3%. These controversial bonds have fallen from favor as investors have been questioning their authenticity and actual impact. SIFMA Q3 2024: SIFMA issuance data through the end of 2024 is not yet available, but last month SIFMA released third quarter data showing that global green, social and sustainable bond issuance in the third quarter of 2024 reached $210.4 billion. Based on slightly adjusted issuance numbers for the second quarter, this represents a quarter-over-quarter decline of $3.4 billion, or a 1.6% drop. Green bonds accounted for 57.9% of global issuance while sustainability bonds and social bonds represented 25.4% and 16.7%, respectively, of total issuance. Global issuance year-to-date reached $693.5 billion, running ahead of the comparable period last year when volume reached $617.4 billion or over the comparable period in 2023. This represents a $76.1 billion pick up in sustainable bond issuance, or an increase of 12.3%. Against a backdrop of another strong quarter when fixed income issuance in the US reached $2.9 trillion, or a quarter over quarter increase of 16.1%, US sustainable bond issuance in the third quarter came in at $38.3 billion, recording a modest $0.7 billion increase, or 1.9%. Year-to-date, US sustainable bond issuance reached $119.5 billion, for a year-over-year increase of $24.3 billion or 24.3%. It should be noted that SIFMA data tends to understate global sustainable bond issuance as it captures a narrower slice of the market that also includes sustainability linked bonds and notes, for example. More generally, sustainable bond data provided by different data sources can vary by significant margins. |
Short-Term Relative Performance: Selected ESG Indices vs. Conventional Indices |
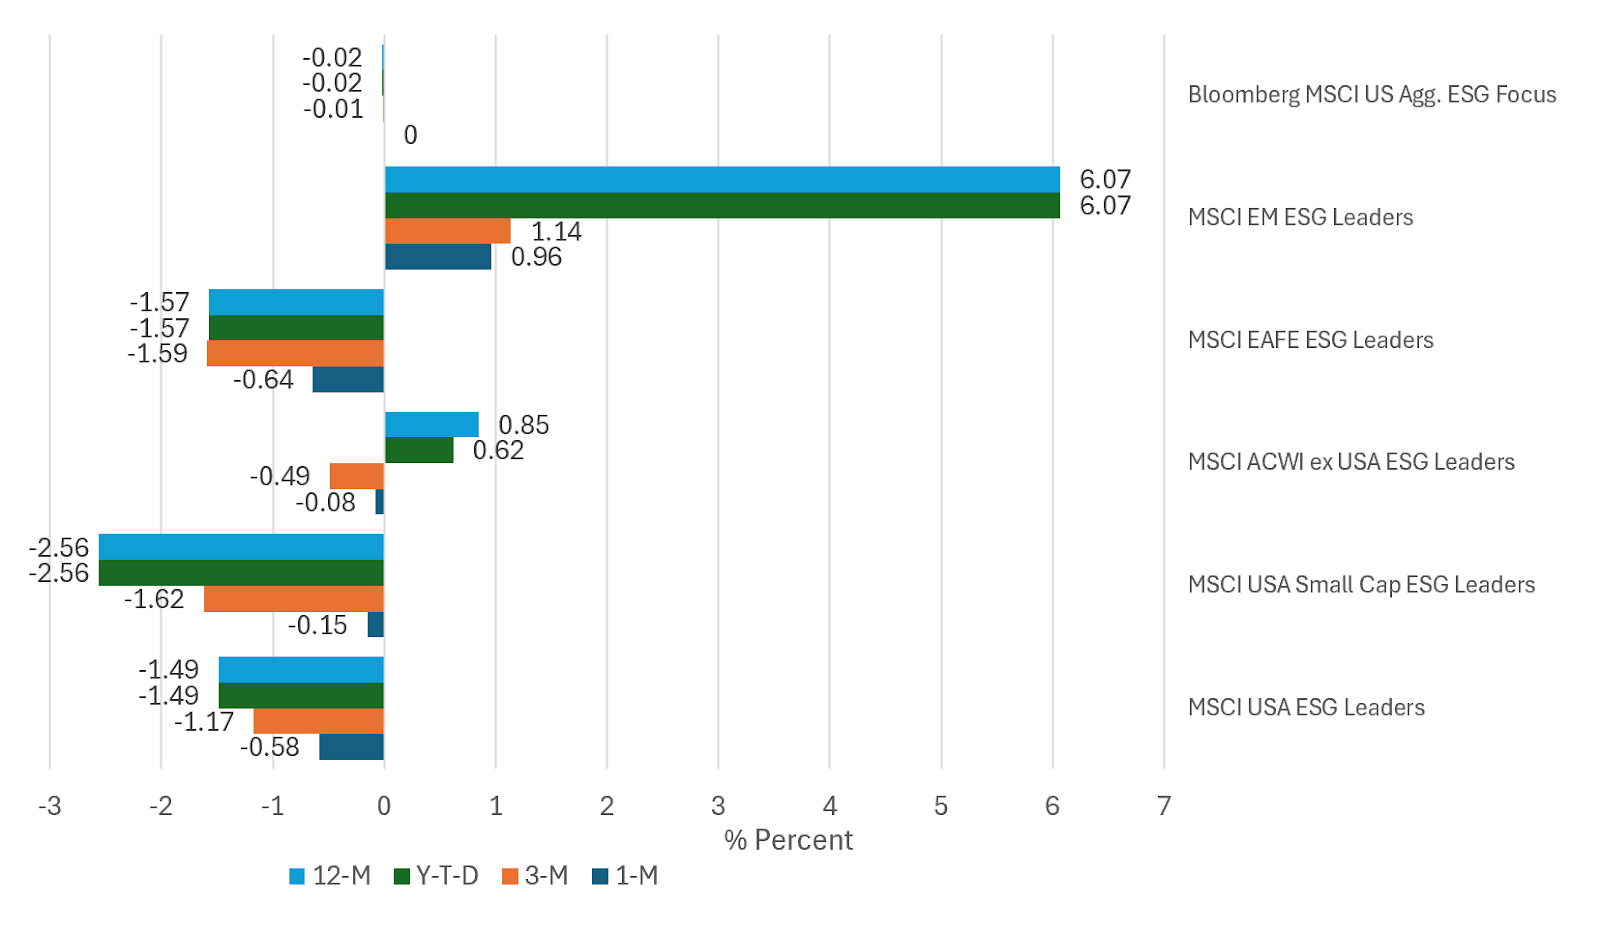
Whereas the month of December ended on a down note with the S&P 500 giving up 2.4%, large-cap US stocks delivered their fourth best annual gain over the last decade. Adding 25.02% in 2024 after an increase of 24.23% in 2023, stocks recorded a two-year total return of 53.19%. This was against a backdrop of better than average expected earnings growth for 2024 and growth of earnings for the fourth straight year, juxtaposed against geopolitical uncertainty, doubts about the economy’s strength and lingering concerns about inflation as well as interest rates, particularly considering reservations associated with trade, taxes and immigration policies advocated by the incoming Trump administration. In fact, some of these considerations have stimulated generally bearish investment outlooks for 2025. The US led global equity returns while developed as well as developing markets, excluding the US, recorded a twelve-month return of 6.15%. US bond returns were more subdued in 2024, with intermediate investment grade bonds gaining just 1.25%. Focused sustainable long-term funds registered an average total return decline of -3.25% in December and an average increase of 8.60% or 13.6% on an asset-weighted basis for the full year 2024. For further details, refer to Sustainable investment funds performance wrap-up: December 2024. Against this backdrop, a selection of five US and international equity ESG Leaders indices and one fixed income benchmark, for a total of six benchmarks constructed by MSCI around ESG screening and exclusionary criteria, failed to outperform their conventional counterparts in December. The five US and international equity-oriented ESG Leaders indices, including the MSCI USA ESG Leaders Index, the MSCI USA Small Cap ESG Leaders Index, the MSCI ACWI ex USA ESG Leaders Index, the MSCI EAFTE ESG Leaders Index and the MSCI Emerging Markets ESG Leaders Index, trailed by between 8 basis points (bps) and 96 basis points in December. At the same time, the Bloomberg MSCI US Aggregate ESG Focus Index came in even with its Bloomberg US Aggregate Bond Index counterpart. Results for the entire year 2024 were not as lopsided but still leaning to underperformance. Two international indices outperformed, with the MSCI Emerging Markets ESG Leaders Index gaining 20.75% versus 14.68% for its conventional counterpart, for a 6.07% spread, the second widest spread in the last ten years. The performance of emerging markets also boosted the performance of the MSCI ACWI ex USA ESG Leaders Index. At the same time, the other four indices underperformed in 2024 relative to their conventional counterparts by a relatively small .02% for the Bloomberg MSCI US Aggregate ESG Focus Index to a wider deficit of 2.56% registered by the MSCI USA Small Cap ESG Leaders Index. Over the intermediate and long-term, relative performance results through the end of the year remain uneven. Equity and fixed income ESG indices lagged their conventional benchmarks over the three-year period. At the same time, relative performance results improve over the five and ten years to year-end 2024. Three indices outperformed over the previous five years and three of five indices, all international benchmarks, including EAFE, ACWI ex USA and Emerging Markets, outperformed their conventional counterparts over the extended ten-year time interval. It should be said, however, that the ten 10-year track record attributed to ESG indices is subject to interpretation in the light of significant operational and definitional changes over that time interval. 3-year and 5-year proxies may be better indicators. |
Sources: Morningstar Direct, MSCI, SIFMA/Dealogic and Sustainable Research and Analysis LLC