Sustainable mutual funds and exchange traded funds (ETFs)
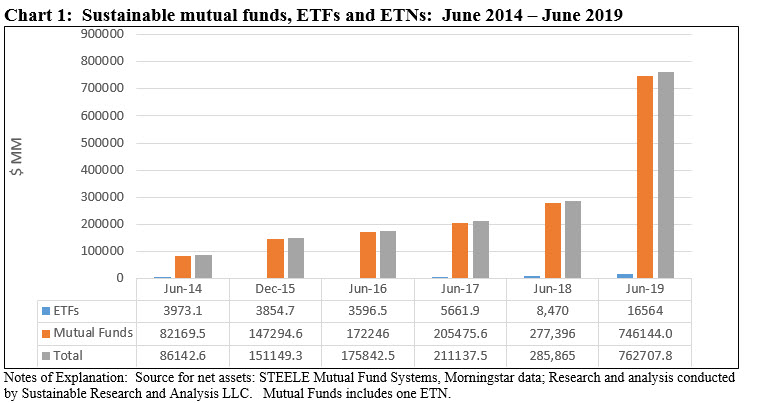
Total net assets of sustainable mutual funds, ETFs and ETNs stood at $762.7 billion as of June 30, 2019, versus $86.1 billion as of June 30, 2014, or an increase of 785%. Since the start of the year, sustainable fund assets gained $372.2 billion, or an increase of 95.4% (Note: sustainable fund assets ended August 2019 at $772.7 billion). Refer to Chart 1.

Top 20 sustainable fund firms
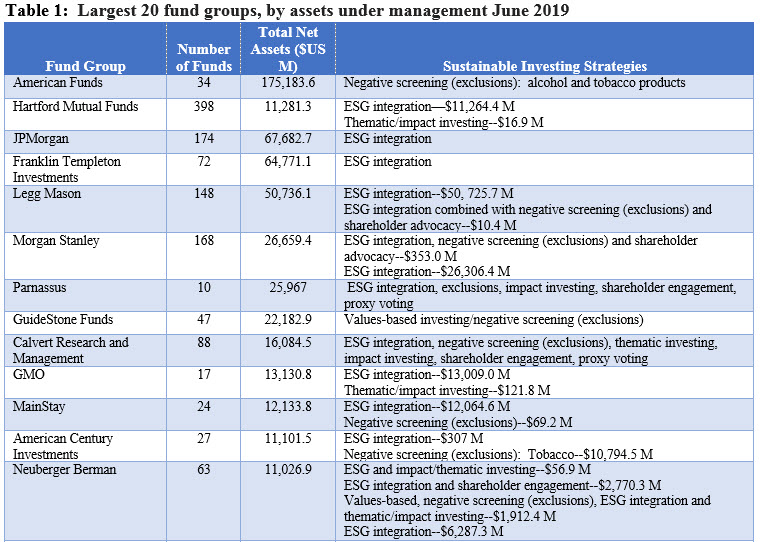
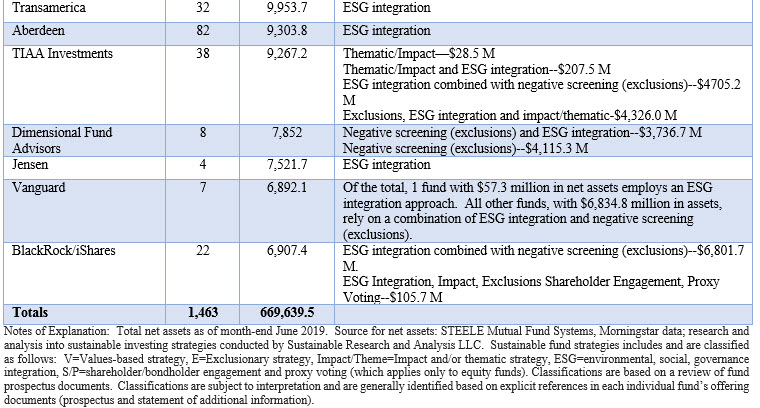
Top 20 fund firms offer 1,463 sustainable mutual funds/share classes and ETFs with total net assets in the amount of $669.6 billion. This represents 87.8% of the $762.7 billion in sustainable mutual fund, ETF and ETN assets as of June 30, 2019; and about 66% of the total sustainable funds universe consisting of 2,227 funds/share classes and ETFs/ETNs. Refer to Table 1.
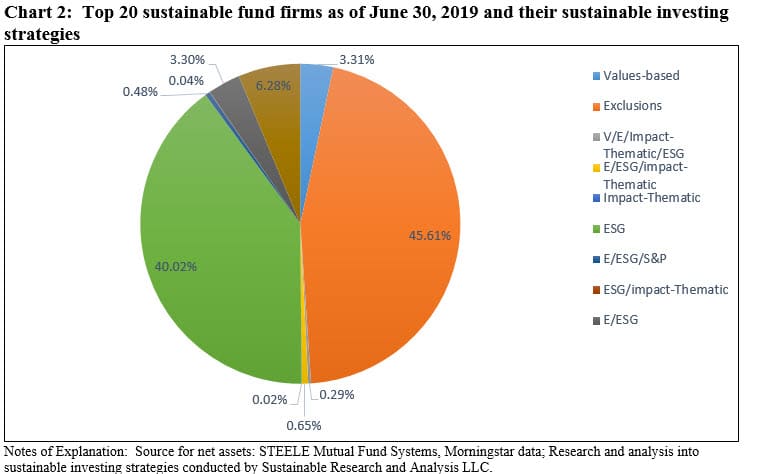
Based on the classification of sustainable investing strategies below, the most common individual sustainable strategy involves negative screening or exclusions. $305.4 billion in net assets, or 45.61%, fall into this category. That said, a negative screening or exclusionary approach is also employed in combination with other strategies, such as ESG integration. Refer to Chart 2.
The next most common individual sustainable strategy involves ESG integration. This category has attracted $268 billion in net assets, or 40.02%. Here too, ESG integration is also combined with other sustainable approaches. This is also the fastest growing strategy which has been significantly bolstered by the rebranding existing funds. Refer to Chart 2.
The combination of negative screening (exclusions), impact-thematic investing, ESG integration and shareholder engagement in addition to proxy voting, has attracted $42.1 billion in net assets or 6.28% of net assets. This is followed by values-based investing with its $22.2 billion in net assets, or 3.31%. Refer to Chart 2.
Classification of sustainable fund strategies: V=Values-based strategy (i.e. religious, social, ethical), E=Exclusionary strategy, Impact/Theme=Impact and/or thematic strategy, ESG=environmental, social, governance integration, S/P=shareholder/bondholder engagement and proxy voting. Classifications are based on a review of fund prospectus documents. Classifications are subject to interpretation and are generally identified based on explicit references in each individual fund’s offering documents (prospectus and statement of additional information). So for example, if the prospectus does not mention that the fund or fund company employs a shareholder engagement approach, such a strategy is not ascribed to the fund.


