Summary
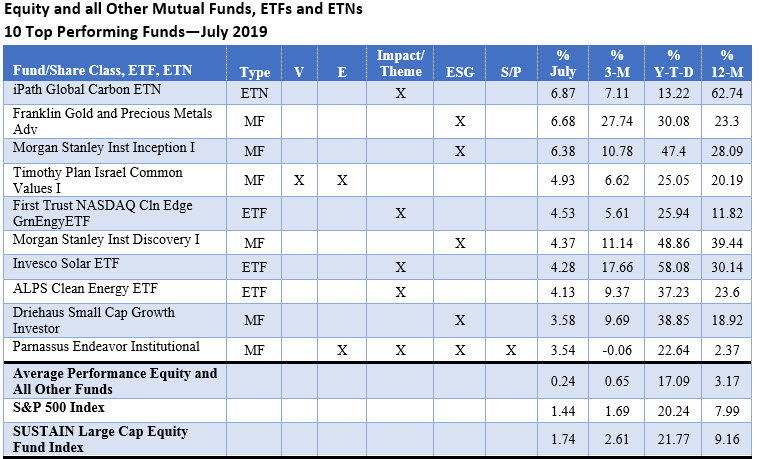
Gaining an average of 0.40%, sustainable bond funds exceeded the average performance of equity and related funds with their average gain of 0.24%. Stocks, as measured by the S&P 500 Index, took a breather in July to end the month up 1.4% following June’s gain of 7.0%. The Federal Reserve Bank lowered the target range for the federal funds rate to 2 to 2-1/4 percent while 10-year Treasury yields ended the month at 2.02%, 2 basis points higher relative to the prior month-end. The Bloomberg Barclays US Aggregate Index was up 0.22%.
Equity Funds and All Other Funds
Sustainable investing strategies employed by the top 10 performing equity funds were more varied than the bottom performing funds. The thematic iPath Global Carbon ETN that invests in carbon credits posted the best total return result in July, up 6.87%. This was 6.63% higher than the average return recorded by all sustainable equity and other equity related funds. It was followed by Franklin Gold and Precious Metals Adv Fund, an ESG integrator, that registered a gain of 6.68% as well as several thematic funds that invest in clean energy and solar companies. These funds generated results that ranged between 4.28% and 4.53%.
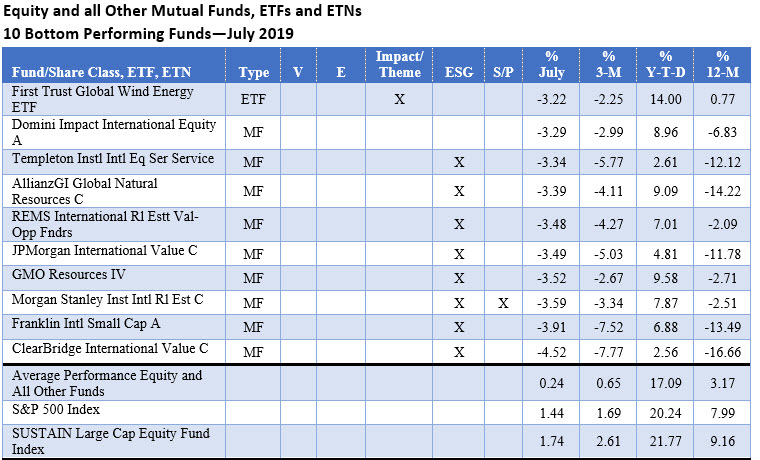
The list of the 10 bottom performing equity funds was dominated by investment vehicles that integrated ESG, led by ClearBridge International Value C Fund registered the lowest return in July, -4.52%.
The rest of the pack also included other international funds investing in real estate, natural resources and wind energy. Each of these posted negative returns ranging from -3.59% to -3.22%.
Fixed Income Funds: July 2019
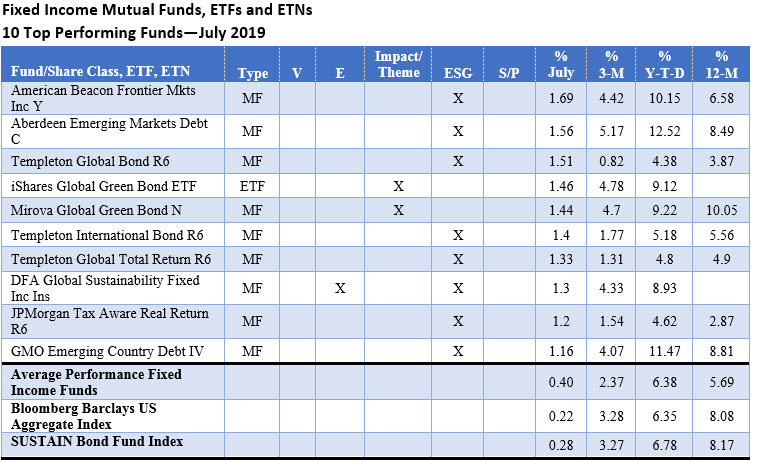
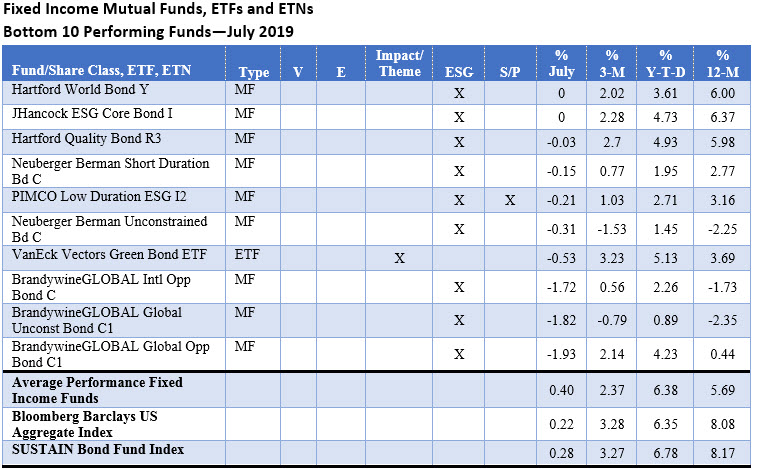
Frontier and emerging market debt funds the integrate ESG were the best performing sustainable bond funds in July, adding 1.69% and 1.56%, respectively, whereas the average performance of all sustainable bond funds was 0.40%. Two green bond funds made the list of the top 10 performing bond funds with returns of 1.46% and 1.44% while a third green bond fund, the VanEck Vectors Green Bond ETF recorded a -0.53% return. Unlike the iShares Global Green Bond ETF and Mirova Global Green Bond Fund N, the VanEck fund does not hedge out its currency risk and the strong dollar impacted the fund.
The lowest fixed income results in July were posted by three global and international funds managed by Brandywine that integrate ESG factors that likewise do not hedge their foreign currency exposures and were negatively impacted by the stronger dollar.
Sustainable Investing Strategies
Funds employing ESG integration strategies, either exclusively or in combination with exclusions, impact/thematic and shareholder/bondholder engagement approaches, dominated the leaders and laggards tables as 30 funds fall into this category. Funds employing an impact/thematic approach either exclusively or in combination with other strategies, comprised the second most common sustainable strategy among the leading and lagging funds in June—with 8 funds falling into this category.


Notes of Explanation covering equity and all other funds: Results are total returns. For funds that have rebranded (by adopting via a prospectus amendment a sustainable investing strategy) during the last 12-months, returns for periods longer than one-month may not reflect results achieved pursuant to the newly adopted sustainable investing strategies. Equity funds include all US and international equity as well as all other funds, except for fixed income funds, a total of 1,695 funds/share classes, ETFs, ETNs with performance for the full month of July 2019. Blanks for other time periods indicate that the fund was not in operations during the entire time interval. Top 10 defined as top 10 funds, excluding multiple share classes of the same fund (i.e. if more than one share class landed in the top of bottom listing of the 10 funds only the best performing one fund/share class is included. V=Values-based strategy, E=Exclusionary strategy, Impact/Theme=Impact and/or thematic strategy, ESG=environmental, social, governance integration, S/P=shareholder/bondholder engagement and proxy voting. Sources: STEELE Mutual Fund Expert, Morningstar data and Sustainable Research and Analysis.
Notes of Explanation covering fixed income funds. Results are total returns. For funds that have rebranded (by adopting via a prospectus amendment a sustainable investing strategy) during the last 12-months, returns for periods longer than one-month may not reflect results achieved pursuant to the newly adopted sustainable investing strategies. Fixed income funds include short and long-term taxable and tax-exempt bond funds and ETFs, a total of 567 funds/share classes, ETFs, ETNs with performance for the full month of July 2019. Blanks for other time periods indicate that the fund was not in operations during the entire time interval. Top 10 defined as top 10 funds, excluding multiple share classes of the same fund (i.e. if more than one share class landed in the top of bottom listing of the 10 funds only the best performing one fund/share class is included. V=Values-based strategy, E=Exclusionary strategy, Impact/Theme=Impact and/or thematic strategy, ESG=environmental, social, governance integration, S/P=shareholder/bondholder engagement and proxy voting. Sources: STEELE Mutual Fund Expert, Morningstar data and Sustainable Research and Analysis.
Sustainable Investment Funds Performance Scorecard: July 2019
Summary Gaining an average of 0.40%, sustainable bond funds exceeded the average performance of equity and related funds with their average gain of 0.24%. Stocks, as measured by the S&P 500 Index, took a breather in July to end the month up 1.4% following June’s gain of 7.0%. The Federal Reserve Bank lowered the target…
Share This Article:
Summary
Gaining an average of 0.40%, sustainable bond funds exceeded the average performance of equity and related funds with their average gain of 0.24%. Stocks, as measured by the S&P 500 Index, took a breather in July to end the month up 1.4% following June’s gain of 7.0%. The Federal Reserve Bank lowered the target range for the federal funds rate to 2 to 2-1/4 percent while 10-year Treasury yields ended the month at 2.02%, 2 basis points higher relative to the prior month-end. The Bloomberg Barclays US Aggregate Index was up 0.22%.
Equity Funds and All Other Funds
Sustainable investing strategies employed by the top 10 performing equity funds were more varied than the bottom performing funds. The thematic iPath Global Carbon ETN that invests in carbon credits posted the best total return result in July, up 6.87%. This was 6.63% higher than the average return recorded by all sustainable equity and other equity related funds. It was followed by Franklin Gold and Precious Metals Adv Fund, an ESG integrator, that registered a gain of 6.68% as well as several thematic funds that invest in clean energy and solar companies. These funds generated results that ranged between 4.28% and 4.53%.
The list of the 10 bottom performing equity funds was dominated by investment vehicles that integrated ESG, led by ClearBridge International Value C Fund registered the lowest return in July, -4.52%.
The rest of the pack also included other international funds investing in real estate, natural resources and wind energy. Each of these posted negative returns ranging from -3.59% to -3.22%.
Fixed Income Funds: July 2019
Frontier and emerging market debt funds the integrate ESG were the best performing sustainable bond funds in July, adding 1.69% and 1.56%, respectively, whereas the average performance of all sustainable bond funds was 0.40%. Two green bond funds made the list of the top 10 performing bond funds with returns of 1.46% and 1.44% while a third green bond fund, the VanEck Vectors Green Bond ETF recorded a -0.53% return. Unlike the iShares Global Green Bond ETF and Mirova Global Green Bond Fund N, the VanEck fund does not hedge out its currency risk and the strong dollar impacted the fund.
The lowest fixed income results in July were posted by three global and international funds managed by Brandywine that integrate ESG factors that likewise do not hedge their foreign currency exposures and were negatively impacted by the stronger dollar.
Sustainable Investing Strategies
Funds employing ESG integration strategies, either exclusively or in combination with exclusions, impact/thematic and shareholder/bondholder engagement approaches, dominated the leaders and laggards tables as 30 funds fall into this category. Funds employing an impact/thematic approach either exclusively or in combination with other strategies, comprised the second most common sustainable strategy among the leading and lagging funds in June—with 8 funds falling into this category.
Notes of Explanation covering equity and all other funds: Results are total returns. For funds that have rebranded (by adopting via a prospectus amendment a sustainable investing strategy) during the last 12-months, returns for periods longer than one-month may not reflect results achieved pursuant to the newly adopted sustainable investing strategies. Equity funds include all US and international equity as well as all other funds, except for fixed income funds, a total of 1,695 funds/share classes, ETFs, ETNs with performance for the full month of July 2019. Blanks for other time periods indicate that the fund was not in operations during the entire time interval. Top 10 defined as top 10 funds, excluding multiple share classes of the same fund (i.e. if more than one share class landed in the top of bottom listing of the 10 funds only the best performing one fund/share class is included. V=Values-based strategy, E=Exclusionary strategy, Impact/Theme=Impact and/or thematic strategy, ESG=environmental, social, governance integration, S/P=shareholder/bondholder engagement and proxy voting. Sources: STEELE Mutual Fund Expert, Morningstar data and Sustainable Research and Analysis.
Notes of Explanation covering fixed income funds. Results are total returns. For funds that have rebranded (by adopting via a prospectus amendment a sustainable investing strategy) during the last 12-months, returns for periods longer than one-month may not reflect results achieved pursuant to the newly adopted sustainable investing strategies. Fixed income funds include short and long-term taxable and tax-exempt bond funds and ETFs, a total of 567 funds/share classes, ETFs, ETNs with performance for the full month of July 2019. Blanks for other time periods indicate that the fund was not in operations during the entire time interval. Top 10 defined as top 10 funds, excluding multiple share classes of the same fund (i.e. if more than one share class landed in the top of bottom listing of the 10 funds only the best performing one fund/share class is included. V=Values-based strategy, E=Exclusionary strategy, Impact/Theme=Impact and/or thematic strategy, ESG=environmental, social, governance integration, S/P=shareholder/bondholder engagement and proxy voting. Sources: STEELE Mutual Fund Expert, Morningstar data and Sustainable Research and Analysis.
Sustainableinvest.com
Benefits
Free access to regularly updated original research and analysis focused exclusively on sustainable finance and investing, providing investors with the guidance needed to make informed investment decisions that align with their personal values and financial goals while also contributing to the advancement of positive long-term environmental and social outcomes.
By offering financial support for our current work, either in the form of a one-time or regular contributions, you help to defray some of the costs associated with conducting our research and analysis as well as to maintain the www.sustainableinvest.com website.
Helping us to expand our research capabilities and offerings over time to cover additional relevant topics geared to sustainable investors.
Sign up to free newsletters.
By submitting this form, you are consenting to receive marketing emails from: . You can revoke your consent to receive emails at any time by using the SafeUnsubscribe® link, found at the bottom of every email. Emails are serviced by Constant Contact