Sustainable Bottom Line: The largest 50 focused sustainable funds represent a starting point for identifying and evaluating core candidates for building a diversified sustainable portfolio.
The largest 50 focused sustainable funds span 17 investment categories and account for 66% of sustainable assets
The largest 50 long-term sustainable investment funds, with $224.5 billion in assets under management as of March 31, 2025, include active and passively managed funds, span 17 investment categories, and are managed by 22 investment firms. The largest funds make up 66% of the assets representing the universe of focused sustainable long-term mutual funds and ETFs whose net assets stood at $339.0 billion as of the same date. The funds that comprise the segment range in size from $1.3 billion to $26.8 billion in assets, including all related share classes in the case of mutual funds. While the largest funds may not span the variety of investment options that are available across the entire universe of focused sustainable funds, they do represent a good starting point for identifying and evaluating potential candidate funds for consideration in building the core segment of a diversified sustainable investment portfolio.
Actively managed funds and equity-oriented funds continue to make up the largest segment of the largest 50 funds
The segment includes active (53%) as well as passively managed (47%) funds. By far, the largest investment category consists of 17 Large Blend funds that account for 54% of the segment’s net assets under management.
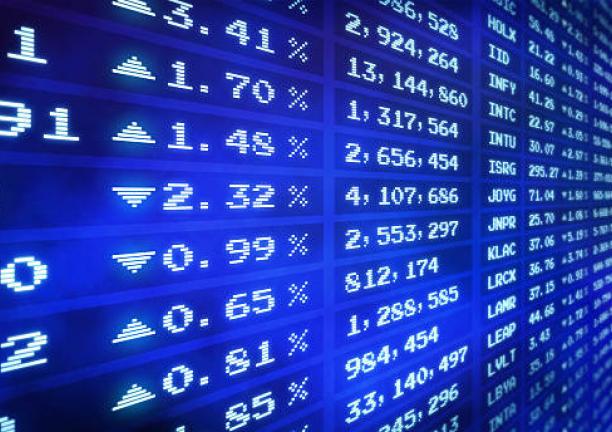
The largest funds posted an average return of -2.5% in the first quarter of the year but maintained a positive trailing 12-month return of 3.3%. Average returns for the 17 investment categories covered by the top 50 funds ranged from a low of -17.14% posted by the iShares Global Clean Energy ETF, the one fund that makes up the Miscellaneous Sector. At the other end of the range is the one fund that comprises the Diversified Emerging Markets investment category, the iShares ESG Aware MSCI Emerging Markets ETF that registered a gain of 10.83%.
Average expense ratios applicable to the largest 50 funds, based on investment categories, ranged from 21 basis points to 116 basis points. That said, the range for individual funds starts at 0.1%.
The Largest 50 focused long-term sustainable mutual funds and ETFs as of March 31, 2025 |
Fund Name | Investment Category | Active/ Passive | Net Assets ($millions) | 3-M Return (%) | 12-M Return (%) | Expense Ratio (%) |
Parnassus Core Equity | Large Blend | Active | 26,765.8 | -2.4 | 5.34 | 0.61 |
Vanguard FTSE Social Index I | Large Blend | Passive | 22,649.1 | -6.21 | 7.25 | 0.07 |
Large Blend | Passive | 12,782.7 | -5.13 | 7.18 | 0.15 | |
Large Blend | Passive | 9,537.9 | -6.32 | 6.27 | 0.09 | |
Foreign Large Blend | Passive | 8,863.8 | 7.46 | 5.57 | 0.21 | |
Brown Advisory Sustainable Growth I | Large Growth | Active | 8,262.6 | -9.98 | -2.28 | 0.61 |
Victory Pioneer A | Large Blend | Active | 8,160.0 | -6.99 | 1.84 | 0.93 |
DFA US Sustainability Core 1 | Large Blend | Active | 7,170.4 | -5.34 | 5.32 | 0.17 |
Nuveen Core Impact Bond R6 | Int. Core Bond | Active | 6,735.9 | 2.69 | 5.26 | 0.36 |
Putnam Sustainable Leaders A | Large Growth | Active | 6,573.0 | -7.82 | -0.41 | 0.87 |
Calvert Equity I | Large Growth | Active | 6,118.6 | -0.38 | 2.48 | 0.65 |
Calvert US Large Cap Core Rspnb Index I | Large Blend | Passive | 5,808.4 | -5.87 | 6.13 | 0.24 |
Nuveen Large Cap Responsible Eq R6 | Large Blend | Active | 5,196.0 | -3.16 | 4 | 0.17 |
Diversified Emerging Markets | Active | 4,490.0 | 4.39 | 10.83 | 0.26 | |
iShares ESG MSCI KLD 400 ETF | Large Blend | Passive | 4,232.2 | -6.96 | 2.53 | 0.25 |
Foreign Large Blend | Passive | 4,124.0 | 4.72 | 5.97 | 0.1 | |
Fidelity U.S. Sustainability Index | Large Blend | Passive | 4,018.3 | -6.55 | 3.38 | 0.11 |
Calvert Bond I | Int. Core-Plus Bond | Active | 3,806.7 | 2.77 | 5.98 | 0.53 |
iShares ESG U.S. Aggregate Bond ETF | Int. Core Bond | Passive | 3,780.2 | 2.75 | 4.87 | 0.1 |
CCM Community Impact Bond Institutional | Int. Core Bond | Active | 3,585.0 | 2.38 | 5.14 | 0.42 |
DFA Intl Sustainability Core 1 | Foreign Large Blend | Active | 3,541.5 | 6.2 | 5.9 | 0.24 |
iShares MSCI USA ESG Select ETF | Large Blend | Passive | 3,426.8 | -5.34 | 6.26 | 0.25 |
Parnassus Value Equity Investor | Large Value | Active | 2,920.9 | -1.98 | -0.35 | 0.88 |
Calvert Small-Cap I | Small Blend | Active | 2,711.2 | -4.33 | 0.15 | 0.94 |
Xtrackers MSCI USA Climate Action Equity ETF | Large Blend | Active | 2,626.6 | -4.22 | 9.23 | 0.07 |
Calvert Short Duration Income I | Short-Term Bond | Active | 2,621.0 | 1.82 | 6.56 | 0.51 |
Parnassus Mid Cap Institutional | Mid-Cap Blend | Active | 2,543.6 | -2.66 | -1.05 | 0.75 |
Eventide Gilead I | Mid-Cap Growth | Passive | 2,509.4 | -7.99 | -10.64 | 1.16 |
Invesco Floating Rate ESG Y | Bank Loan | Active | 2,488.8 | 0.26 | 5.73 | 0.84 |
American Century Large Cap Equity G | Large Blend | Active | 2,403.7 | -7.09 | 0.74 | 0 |
Impax Sustainable Allocation Inv | Moderate Allocation | Active | 2,205.8 | -2.09 | 0.57 | 0.92 |
iShares Climate Conscious &Transition MSCI USA ETF | Large Blend | Passive | 2,125.4 | -4.22 | 9.24 | 0.08 |
Invesco Water Resources ETF | Natural Resources | Passive | 2,052.8 | -1.75 | -2.53 | 0.59 |
First Trust NASDAQ® Clean Edge Smart Grid Infrastructure ETF | Infrastructure | Passive | 2,009.8 | -5.06 | 0.08 | 0.56 |
iShares Paris-Aligned Climate MSCI USA ETF | Large Growth | Passive | 1,975.5 | -7.49 | 6.3 | 0.1 |
Global Large-Stock Blend | Passive | 1,960.0 | -4.24 | 0.09 | ||
Impax Global Environmental Markets Institutional | Global Large-Stock Blend | Active | 1,934.5 | -1.71 | -3.36 | 0.91 |
Calvert US Large Cap Value Rspnb Index I | Large Value | Passive | 1,849.1 | 1.06 | 6.8 | 0.24 |
iShares ESG Aware MSCI USA Small-Cap ETF | Small Blend | Passive | 1,752.4 | -8.32 | -3.36 | 0.17 |
First Trust Water ETF | Natural Resources | Passive | 1,721.8 | -1.23 | -0.68 | 0.53 |
Nuveen ESG Large-Cap Value ETF | Large Value | Passive | 1,665.4 | 2.87 | 6.23 | 0.26 |
Xtrackers S&P 500 Scored and Screened ETF | Large Blend | Passive | 1,654.5 | -5.05 | 6.75 | 0.1 |
PIMCO Total Return ESG Institutional | Int. Core-Plus Bond | Active | 1,614.8 | 3.38 | 5.75 | 0.82 |
SPDR® S&P 500® ESG ETF | Large Blend | Passive | 1,592.9 | -5.05 | 6.78 | 0.1 |
Nuveen ESG Large-Cap Growth ETF | Large Growth | Passive | 1,378.5 | -8.73 | 2.66 | 0.26 |
Boston Trust Walden Small Cap | Small Blend | Active | 1,341.4 | -4.11 | 3.13 | 1 |
Impax International Sust Econ Institutional | Foreign Large Blend | Active | 1,323.9 | 7.47 | 7.62 | 0.45 |
Victory Sustainable World | Global Large-Stock Blend | Active | 1,313.3 | -3.42 | 4.54 | 1.08 |
Misc. Sector | Passive | 1,308.1 | 0.05 | -17.14 | 0.41 | |
Large Blend | Active | 1,288.6 | -5.13 | 5.35 | 0.17 | |
Total/Averages | 224,522.6 | -2.48 | 3.26 | 0.43 |
Notes of Explanation: Funds are arrayed by assets under management (AUM) as of March 31, 2025. For mutual funds, this is the largest share class, by AUM, and the performance results and expense ratios correspond to the indicated share class. AUM reflects the combined assets of the fund. Sources: Morningstar and Sustainable Research and Analysis.