The Bottom Line: While long-term results continue to support ESG screened benchmarks, the positive spreads posted by these indices relative to conventional benchmarks are shrinking.
The S&P 500 dropped 4.1% in August while equity oriented ESG screened indices underperformed
The S&P 500 gave up 4.1% in August while bonds, as measured by the Bloomberg US Aggregate Bond Index, dropped -2.83% and the MSCI ACWI, ex USA Index declined 3.2%. Corresponding ESG screened indices posted drops of 4.26%, -2.80% and -3.80%, respectively. The month started on a positive note as anticipation of a more dovish Federal Reserve moved stocks higher so that by August 16 the S&P 500 was up 4.23%. This began to change as concerns over the Fed interest rate increases and the depth of the consumer pullback pushed the market down. During the last four trading days of August, the S&P 500 posted a decline of 5.8% and shifted its performance for the entire calendar month into the red. Refer to Chart 1. For the full month, the large cap benchmark recorded a total return drop of 4.1% and for the year-to-date period the decline widened to 16.1%. This eight-month large cap stock decline compared to a drop of 11.52% posted by bonds. All but energy and utility stocks ended the month in the red while value stocks outperformed growth stocks and small cap stocks, as measured by the Russell 2000, eclipsed large cap stocks with a decline of 2.1%.
The MSCI ACWI, ex USA Index fell 3.2% in August and a negative 18% year-to-date. Emerging markets, up 0.5%, lifted the index which was otherwise dragged down by Europe, including France, Germany and the UK. Each recorded a decline of 6.4%, 6.4% and 5.6%, respectively. Emerging markets Brazil and India recorded gains of 6.5% and 4.2%, in that order.
The performance of bonds over the previous eight- and twelve-month intervals has not offered investors any relief and it has diminished the benefit of diversification with bonds—at least over the short-term. August was another tough month for bonds, as the Bloomberg US Aggregate Bond Index dropped another 2.83% to push the trailing 12-month results to -11.52%. The probability of a 50-basis points (bps) hike in interest rates in September versus a 75-bps hike shifted during the month. By the end of August, the probability of a higher rate hike gained momentum. The 2-year Treasury yield touched 3.5%, higher by 58bps during the month, while the 10-year yield saw a 35bps move higher
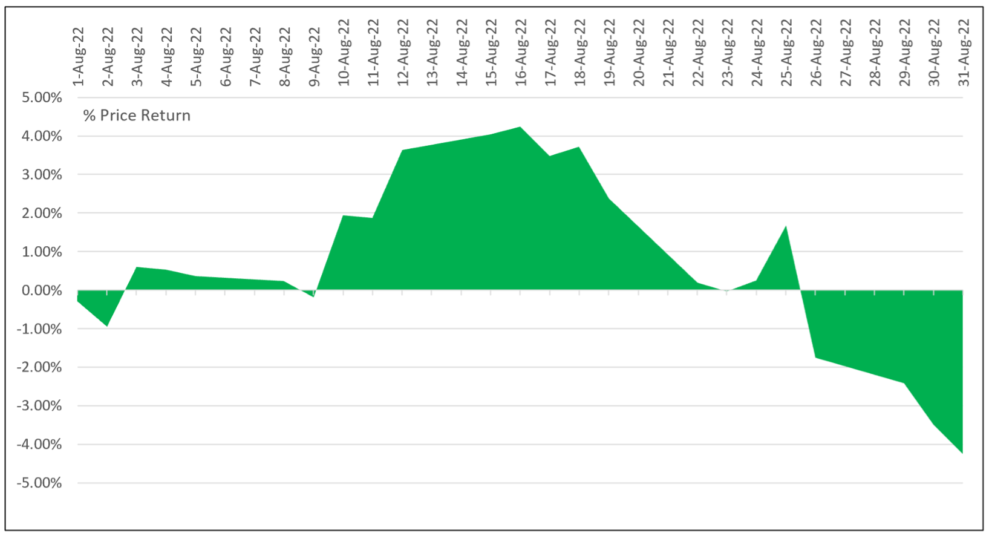
Chart 1: S&P 500 Index cumulative price only rates of return-August 2022
 Source: Yahoo Finance
Sustainable mutual funds and ETFs recorded a negative average return of -3.37%
The universe of sustainable mutual funds and ETFs as defined by Morningstar, a total of 1,345 funds as of August 31, 2022, posted an average total return of -3.37%. Returns, which again reversed course from last month’s average gain of 6.5%, ranged from a high of 9.66% achieved by the Eventide Healthcare & Life Sciences Fund A (ETIHX) along with slightly lower but still leading returns recorded by the fund’s three additional share classes, to a -12.52% low recorded by the Segall Bryant & Hamill Workplace Equity Fund Institutional Shares (WEQIX). Refer to Tables 1a and 1b.
Once again this month, the list of top performing funds was dominated by renewable energy funds. Fund securities holdings, in particular issuers listed in the US, benefited from the passage of the Inflation Reduction Act of 2022 (IRA) that advances key climate goals. Signed into law by President Joe Biden on August 16, the bill is designed to raise approximately $737 billion in revenue over ten years through a 15% corporate minimum tax on companies earning over $1 billion in profits, a 1% tax on stock buybacks, greater IRS enforcement, and to allow Medicare officials to negotiate directly on prescription drug costs. The IRA would spend $437 billion on climate investment and extended health care subsidies. From an economic perspective, the IRA is expected to have a limited impact on inflations, but it should reduce the deficit as well as corporate profits, bolster state and local government investments in green technology and create opportunities for stock and bond investors. For example, the bill provides for the creation of transferrable tax credits, and it is likely to bolster issuance of sustainability-lined bonds. The IRA provides tax credits to reduce the cost to deploy new wind and solar assets, acquire new electric and hybrid vehicles, and invest in renewables and clean energy technologies, including clean hydrogen production and carbon capture and storage (CCS). According to the Rhodium Group, these provisions in the bill are likely to reduce carbon emissions 37% to 41% below 2005 levels by 2030.
Table 1a: Top 10 performing funds Table 1b: Bottom 10 performing funds
Fund Name | 1-M TR (%) | 12-M TR (%) | Fund Name | 1-M TR (%) | 12-M TR (%) |
Eventide Healthcare & Life Sciences A | 9.66 | -27.47 | Cromwell Tran Sustainable Focus Instl | -7.66 | -27.72 |
ALPS Clean Energy ETF | 5.89 | -9.97 | BlackRock Sustainable International Eq Inv A | -7.75 | |
SPDR® Kensho Clean Power ETF | 4.5 | -0.66 | IQ Clean Oceans ETF | -7.93 | |
Direxion Hydrogen ETF | 4.22 | -20.75 | ETRACS 2x Leveraged MSCI US ESG Focus TR Exchange Traded Note | -8.05 | |
ProShares S&P Kensho Cleantech ETF | 3.87 | | Calvert International Equity C | -8.11 | -23.95 |
WisdomTree India ex-State-Owned Enterprises | 3.38 | -4.97 | Mirova International Sustainable Eq A | -8.27 | -32.45 |
Global X Clean Tech ETF | 3.1 | -17.14 | Calvert International Opportunities C | -8.38 | -32.18 |
First Trust NASDAQ® Clean Edge® Green Energy TF | 2.97 | -4.16 | Martin Currie International Sust Eq A | -9.18 | -33.46 |
Invesco WilderHill Clean Energy ETF | 2.88 | -28.07 | KraneShares MSCI China Clean Tech ETF | -9.63 | -26.92 |
Defiance Next Gen H2 ETF | 2.7 | -39.91 | Segall Bryant & Hamill Workplace Eq Institutional Shares | -12.52 | -23.9 |
| | | | | | | |
Notes of Explanation: Performance covering both mutual funds and ETFs=total returns in percentage terms for periods ending May 31, 2022. 1-M=1 month, 12-M=12 months. Blank cells=fund was not in operation during entire interval. Source: Morningstar Direct.
Performance of ESG screened US, global and international equity indices lagged behind their conventional counterparts while bonds prevailed
Based on total returns posted by selected MSCI ESG Leaders indices, the performance of five ESG screened US, global and international equity indices lagged behind their conventional counterparts in August while bonds pulled ahead by three basis points. That positive spread turned negative as ESG screened bonds measured by the Bloomberg MSCI ESG Focus Aggregate Bond Index over the previous 12-months trailed the conventional counterpart benchmark by 2 bps.
The total return performance of ESG screened equity indices in August displayed negative variances ranging from 4 bps for the MSCI USA Small Cap ESG Leaders Index to a high of 1.01% posted by the MSCI USA ESG Leaders Index. Negative variances, except for small cap stocks, extended to the trailing one-year interval as market sentiment shifted away from over-weighted positions in growth-oriented technology stocks and in favor of limited exposures to fossil fuels.
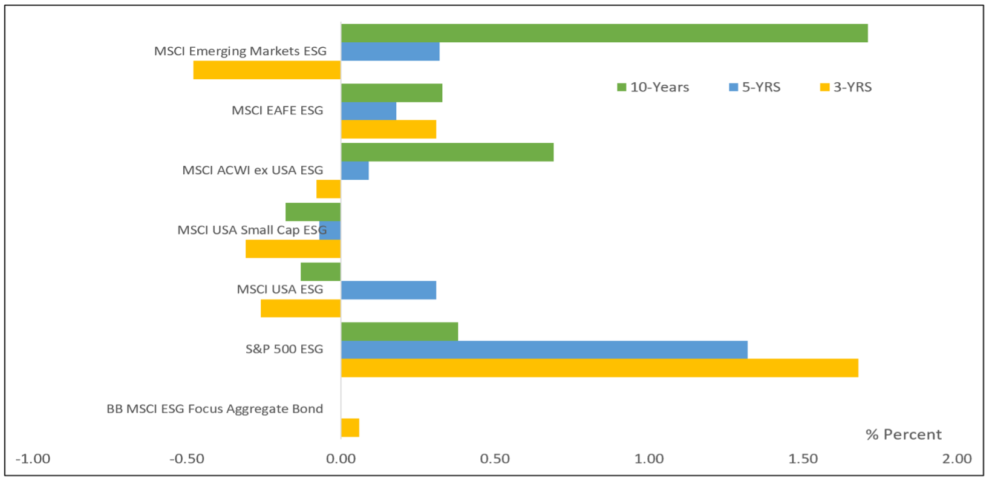
While long-term results continue to support ESG screened benchmarks, the leads posted by these indices relative to conventional benchmarks have been shrinking. This is especially the case for global and international stocks. For example, as of January 31, 2020, while still positive, the spreads between the MSCI ACWI ex USA ESG Leaders Index, MSCI EAFE ESG Leaders Index and MSCI Emerging Markets ESG Leaders Index have narrowed to within 69 bps, 88 bps and 355 bps, respectively. These positive variances have declined by almost two-thirds in each case. US small cap ESG screened stocks are an exception, in that 3-, 5- and 10-year results have lagged. Refer to Chart 2.
Chart 2: Selected sustainable indices intermediate and long-term relative total return performance results to August 31, 2022
 Notes of Explanation: MSCI equity indices are the ESG Leaders indices while fixed income is ESG Focus. Blanks indicate performance results are not available. Intermediate and long-term results include 3-5-and 10-year returns that are expressed as average annual returns. MSCI USA Small Cap returns are price only. Sources: MSCI, S&P Global, Sustainable Research and Analysis LLC.
SRA Select List of funds posted an average decline of 2.90% in August
SRA Select funds posted an average drop of 2.90% in August versus an average -2.39% registered by the performance of corresponding conventional benchmarks[1]. Excluding money market funds, returns ranged from low of -6.02% recorded by the iShares ESG Aware MSCI EAFE ETF (ESGD) to a high of -0.69% posted by the iShares ESG MSCI Emerging Markets Leaders ETF (LDEM). Refer to Table 2 for a complete rundown of SRA Select list of mutual funds and ETFs and their August performance results.
Consisting of nine funds[2] pursuing discrete investment strategies intend for use as building blocks in the creation of a diversified ESG-oriented portfolio, seven of the nine funds underperformed their conventional benchmarks in August. Eight of the nine funds trailed for the 12-month interval while six of eight funds underperformed over the trailing three-years. (Refer to previously published article SRA Select Listing: ESG Integration Investment Fund Q1-2022 https://sustainableinvest.com/sra-select-listing-esg-integration-investment-funds-q1-2022/).
[1] To avoid duplications, these average results exclude Vanguard Treasury Money Market Fund and S&P 500 Index.
[2] A tenth fund, the Vanguard Treasury Money Market Fund, is an alternative money market fund.
Table 2: Performance of SRA Select listed mutual funds and ETFs-August 2022
Fund name/Index | Expense Ratio (%) | Assets ($ M) | 1-Month Total Return (%) | Y-T-D Total Return (%) | 12-Month Total Return (%) | 3-Year Average TR (%) |
iShares ESG Advanced Hi Yld Corp Bd ETF (HYXF) | 0.45 | 133.3 | -2.98 | -11.33 | -11.25 | -0.26 |
iShares ESG Aware MSCI EAFE ETF (ESGD) | 0.35 | 6376.6 | -6.02 | -20.4 | -20.54 | 2.55 |
iShares ESG Aware MSCI USA Small-Cap ETF (ESML) | 0.2 | 1475.8 | -2.67 | -15.61 | -15.03 | 10.14 |
iShares ESG U.S. Aggregate Bond ETF (EAGG) | 0.17 | 2175.1 | -2.8 | -10.74 | -11.63 | -2.1 |
iShares MSCI ACWI Low Carbon Target ETF (CRBN) | 0.1 | 869.7 | -4.15 | -18.41 | -16.5 | 8.01 |
iShares MSCI KLD 400 Social ETF (DSI) | 0.2 | 3668.3 | -4.85 | -19.57 | -14.24 | 12.14 |
iShares USD Green Bond ETF (BGRN) | 0.25 | 291.3 | -2.17 | -11.32 | -12.73 | -3.35 |
iShares® ESG MSCI EM Leaders ETF (LDEM) | 0.2 | 60.4 | -0.69 | -19.86 | -25.25 | |
BlackRock Liquid Environmentally Aware Inv A (LEAXX) | 0.16 | 1,131.2 | 0.21 | 0.38 | 0.36 | 0.44 |
Vanguard Treasury Money Market Fund Investor (VUSXX) | 0.09 | 34,297 | 0.16 | 0.45 | 0.45 | 0.51 |
Averages/Total* | 0.22 | 50,478.7 | -2.90 | -14.10 | -14.09 | 3.45 |
S&P 500 Index | | | -4.08 | -16.14 | -11.23 | 12.39 |
MSCI USA Index | | | -3.92 | -17.13 | -13.08 | 12.36 |
MSCI USA Small Cap Index | | | -2.66 | -16.09 | -15.93 | 8.47 |
MSCI EAFE Index (Net) | | | -4.75 | -19.57 | -19.8 | 2.39 |
MSCI ACWI Index (Net) | | | -3.68 | -17.75 | -15.88 | 8.03 |
MSCI Emerging Markets Index (Net) | | | 0.42 | -17.49 | -21.8 | 2.74 |
Bloomberg U.S. Treasury Bill (1-3 M) | | | 0.18 | 0.42 | 0.44 | 0.54 |
Bloomberg U.S. Aggregate Bond Index | | | -2.83 | -10.75 | -11.52 | -2.0 |
Bloomberg U.S. Corporate High Yield Index | | | -2.3 | -11.22 | -10.6 | 1.03 |
S&P Green U.S. Dollar Select Index | | | -1.85 | -10.85 | -12.53 | -1.82 |
Averages** | | | -2.39 | -13.41 | -13.39 | 1.85 |
Notes of Explanation: Assets=Net Assets in millions. Blank cells=fund was not in operation during entire interval. *Average returns exclude the Vanguard Treasury Money Market Fund Investor. **Average returns exclude the S&P 500 Index to avoid double counting. Sources: Morningstar Direct and MSCI.
The S&P 500 dropped 4.1% in August while equity oriented ESG screened indices underperformed
The Bottom Line: While long-term results continue to support ESG screened benchmarks, the positive spreads posted by these indices relative to conventional benchmarks are shrinking. The S&P 500 dropped 4.1% in August while equity oriented ESG screened indices underperformed
Share This Article:
The Bottom Line: While long-term results continue to support ESG screened benchmarks, the positive spreads posted by these indices relative to conventional benchmarks are shrinking.
The S&P 500 dropped 4.1% in August while equity oriented ESG screened indices underperformed
The S&P 500 gave up 4.1% in August while bonds, as measured by the Bloomberg US Aggregate Bond Index, dropped -2.83% and the MSCI ACWI, ex USA Index declined 3.2%. Corresponding ESG screened indices posted drops of 4.26%, -2.80% and -3.80%, respectively. The month started on a positive note as anticipation of a more dovish Federal Reserve moved stocks higher so that by August 16 the S&P 500 was up 4.23%. This began to change as concerns over the Fed interest rate increases and the depth of the consumer pullback pushed the market down. During the last four trading days of August, the S&P 500 posted a decline of 5.8% and shifted its performance for the entire calendar month into the red. Refer to Chart 1. For the full month, the large cap benchmark recorded a total return drop of 4.1% and for the year-to-date period the decline widened to 16.1%. This eight-month large cap stock decline compared to a drop of 11.52% posted by bonds. All but energy and utility stocks ended the month in the red while value stocks outperformed growth stocks and small cap stocks, as measured by the Russell 2000, eclipsed large cap stocks with a decline of 2.1%.
The MSCI ACWI, ex USA Index fell 3.2% in August and a negative 18% year-to-date. Emerging markets, up 0.5%, lifted the index which was otherwise dragged down by Europe, including France, Germany and the UK. Each recorded a decline of 6.4%, 6.4% and 5.6%, respectively. Emerging markets Brazil and India recorded gains of 6.5% and 4.2%, in that order.
The performance of bonds over the previous eight- and twelve-month intervals has not offered investors any relief and it has diminished the benefit of diversification with bonds—at least over the short-term. August was another tough month for bonds, as the Bloomberg US Aggregate Bond Index dropped another 2.83% to push the trailing 12-month results to -11.52%. The probability of a 50-basis points (bps) hike in interest rates in September versus a 75-bps hike shifted during the month. By the end of August, the probability of a higher rate hike gained momentum. The 2-year Treasury yield touched 3.5%, higher by 58bps during the month, while the 10-year yield saw a 35bps move higher
Chart 1: S&P 500 Index cumulative price only rates of return-August 2022
Sustainable mutual funds and ETFs recorded a negative average return of -3.37%
The universe of sustainable mutual funds and ETFs as defined by Morningstar, a total of 1,345 funds as of August 31, 2022, posted an average total return of -3.37%. Returns, which again reversed course from last month’s average gain of 6.5%, ranged from a high of 9.66% achieved by the Eventide Healthcare & Life Sciences Fund A (ETIHX) along with slightly lower but still leading returns recorded by the fund’s three additional share classes, to a -12.52% low recorded by the Segall Bryant & Hamill Workplace Equity Fund Institutional Shares (WEQIX). Refer to Tables 1a and 1b.
Once again this month, the list of top performing funds was dominated by renewable energy funds. Fund securities holdings, in particular issuers listed in the US, benefited from the passage of the Inflation Reduction Act of 2022 (IRA) that advances key climate goals. Signed into law by President Joe Biden on August 16, the bill is designed to raise approximately $737 billion in revenue over ten years through a 15% corporate minimum tax on companies earning over $1 billion in profits, a 1% tax on stock buybacks, greater IRS enforcement, and to allow Medicare officials to negotiate directly on prescription drug costs. The IRA would spend $437 billion on climate investment and extended health care subsidies. From an economic perspective, the IRA is expected to have a limited impact on inflations, but it should reduce the deficit as well as corporate profits, bolster state and local government investments in green technology and create opportunities for stock and bond investors. For example, the bill provides for the creation of transferrable tax credits, and it is likely to bolster issuance of sustainability-lined bonds. The IRA provides tax credits to reduce the cost to deploy new wind and solar assets, acquire new electric and hybrid vehicles, and invest in renewables and clean energy technologies, including clean hydrogen production and carbon capture and storage (CCS). According to the Rhodium Group, these provisions in the bill are likely to reduce carbon emissions 37% to 41% below 2005 levels by 2030.
Table 1a: Top 10 performing funds Table 1b: Bottom 10 performing funds
Fund Name
1-M TR
(%)
12-M TR
(%)
Fund Name
1-M TR
(%)
12-M TR
(%)
Eventide Healthcare & Life Sciences A
9.66
-27.47
Cromwell Tran Sustainable Focus Instl
-7.66
-27.72
ALPS Clean Energy ETF
5.89
-9.97
BlackRock Sustainable International Eq Inv A
-7.75
SPDR® Kensho Clean Power ETF
4.5
-0.66
IQ Clean Oceans ETF
-7.93
Direxion Hydrogen ETF
4.22
-20.75
ETRACS 2x Leveraged MSCI US ESG Focus TR Exchange Traded Note
-8.05
ProShares S&P Kensho Cleantech ETF
3.87
Calvert International Equity C
-8.11
-23.95
WisdomTree India ex-State-Owned Enterprises
3.38
-4.97
Mirova International Sustainable Eq A
-8.27
-32.45
Global X Clean Tech ETF
3.1
-17.14
Calvert International Opportunities C
-8.38
-32.18
First Trust NASDAQ® Clean Edge® Green Energy TF
2.97
-4.16
Martin Currie International Sust Eq A
-9.18
-33.46
Invesco WilderHill Clean Energy ETF
2.88
-28.07
KraneShares MSCI China Clean Tech ETF
-9.63
-26.92
Defiance Next Gen H2 ETF
2.7
-39.91
Segall Bryant & Hamill Workplace Eq Institutional Shares
-12.52
-23.9
Notes of Explanation: Performance covering both mutual funds and ETFs=total returns in percentage terms for periods ending May 31, 2022. 1-M=1 month, 12-M=12 months. Blank cells=fund was not in operation during entire interval. Source: Morningstar Direct.
Performance of ESG screened US, global and international equity indices lagged behind their conventional counterparts while bonds prevailed
Based on total returns posted by selected MSCI ESG Leaders indices, the performance of five ESG screened US, global and international equity indices lagged behind their conventional counterparts in August while bonds pulled ahead by three basis points. That positive spread turned negative as ESG screened bonds measured by the Bloomberg MSCI ESG Focus Aggregate Bond Index over the previous 12-months trailed the conventional counterpart benchmark by 2 bps.
The total return performance of ESG screened equity indices in August displayed negative variances ranging from 4 bps for the MSCI USA Small Cap ESG Leaders Index to a high of 1.01% posted by the MSCI USA ESG Leaders Index. Negative variances, except for small cap stocks, extended to the trailing one-year interval as market sentiment shifted away from over-weighted positions in growth-oriented technology stocks and in favor of limited exposures to fossil fuels.
While long-term results continue to support ESG screened benchmarks, the leads posted by these indices relative to conventional benchmarks have been shrinking. This is especially the case for global and international stocks. For example, as of January 31, 2020, while still positive, the spreads between the MSCI ACWI ex USA ESG Leaders Index, MSCI EAFE ESG Leaders Index and MSCI Emerging Markets ESG Leaders Index have narrowed to within 69 bps, 88 bps and 355 bps, respectively. These positive variances have declined by almost two-thirds in each case. US small cap ESG screened stocks are an exception, in that 3-, 5- and 10-year results have lagged. Refer to Chart 2.
Chart 2: Selected sustainable indices intermediate and long-term relative total return performance results to August 31, 2022
SRA Select List of funds posted an average decline of 2.90% in August
SRA Select funds posted an average drop of 2.90% in August versus an average -2.39% registered by the performance of corresponding conventional benchmarks[1]. Excluding money market funds, returns ranged from low of -6.02% recorded by the iShares ESG Aware MSCI EAFE ETF (ESGD) to a high of -0.69% posted by the iShares ESG MSCI Emerging Markets Leaders ETF (LDEM). Refer to Table 2 for a complete rundown of SRA Select list of mutual funds and ETFs and their August performance results.
Consisting of nine funds[2] pursuing discrete investment strategies intend for use as building blocks in the creation of a diversified ESG-oriented portfolio, seven of the nine funds underperformed their conventional benchmarks in August. Eight of the nine funds trailed for the 12-month interval while six of eight funds underperformed over the trailing three-years. (Refer to previously published article SRA Select Listing: ESG Integration Investment Fund Q1-2022 https://sustainableinvest.com/sra-select-listing-esg-integration-investment-funds-q1-2022/).
[1] To avoid duplications, these average results exclude Vanguard Treasury Money Market Fund and S&P 500 Index.
[2] A tenth fund, the Vanguard Treasury Money Market Fund, is an alternative money market fund.
Table 2: Performance of SRA Select listed mutual funds and ETFs-August 2022
Fund name/Index
Expense Ratio (%)
Assets
($ M)
1-Month Total Return (%)
Y-T-D
Total Return (%)
12-Month Total Return (%)
3-Year Average TR (%)
iShares ESG Advanced Hi Yld Corp Bd ETF (HYXF)
0.45
133.3
-2.98
-11.33
-11.25
-0.26
iShares ESG Aware MSCI EAFE ETF (ESGD)
0.35
6376.6
-6.02
-20.4
-20.54
2.55
iShares ESG Aware MSCI USA Small-Cap ETF (ESML)
0.2
1475.8
-2.67
-15.61
-15.03
10.14
iShares ESG U.S. Aggregate Bond ETF (EAGG)
0.17
2175.1
-2.8
-10.74
-11.63
-2.1
iShares MSCI ACWI Low Carbon Target ETF (CRBN)
0.1
869.7
-4.15
-18.41
-16.5
8.01
iShares MSCI KLD 400 Social ETF (DSI)
0.2
3668.3
-4.85
-19.57
-14.24
12.14
iShares USD Green Bond ETF (BGRN)
0.25
291.3
-2.17
-11.32
-12.73
-3.35
iShares® ESG MSCI EM Leaders ETF (LDEM)
0.2
60.4
-0.69
-19.86
-25.25
BlackRock Liquid Environmentally Aware Inv A (LEAXX)
0.16
1,131.2
0.21
0.38
0.36
0.44
Vanguard Treasury Money Market Fund Investor (VUSXX)
0.09
34,297
0.16
0.45
0.45
0.51
Averages/Total*
0.22
50,478.7
-2.90
-14.10
-14.09
3.45
S&P 500 Index
-4.08
-16.14
-11.23
12.39
MSCI USA Index
-3.92
-17.13
-13.08
12.36
MSCI USA Small Cap Index
-2.66
-16.09
-15.93
8.47
MSCI EAFE Index (Net)
-4.75
-19.57
-19.8
2.39
MSCI ACWI Index (Net)
-3.68
-17.75
-15.88
8.03
MSCI Emerging Markets Index (Net)
0.42
-17.49
-21.8
2.74
Bloomberg U.S. Treasury Bill (1-3 M)
0.18
0.42
0.44
0.54
Bloomberg U.S. Aggregate Bond Index
-2.83
-10.75
-11.52
-2.0
Bloomberg U.S. Corporate High Yield Index
-2.3
-11.22
-10.6
1.03
S&P Green U.S. Dollar Select Index
-1.85
-10.85
-12.53
-1.82
Averages**
-2.39
-13.41
-13.39
1.85
Notes of Explanation: Assets=Net Assets in millions. Blank cells=fund was not in operation during entire interval. *Average returns exclude the Vanguard Treasury Money Market Fund Investor. **Average returns exclude the S&P 500 Index to avoid double counting. Sources: Morningstar Direct and MSCI.
Sustainableinvest.com
Benefits
Free access to regularly updated original research and analysis focused exclusively on sustainable finance and investing, providing investors with the guidance needed to make informed investment decisions that align with their personal values and financial goals while also contributing to the advancement of positive long-term environmental and social outcomes.
By offering financial support for our current work, either in the form of a one-time or regular contributions, you help to defray some of the costs associated with conducting our research and analysis as well as to maintain the www.sustainableinvest.com website.
Helping us to expand our research capabilities and offerings over time to cover additional relevant topics geared to sustainable investors.
Sign up to free newsletters.
By submitting this form, you are consenting to receive marketing emails from: . You can revoke your consent to receive emails at any time by using the SafeUnsubscribe® link, found at the bottom of every email. Emails are serviced by Constant Contact