


Sustainable Bottom Line: Expense ratios of actively managed labeled sustainable mutual funds and ETFs, averaging 86 basis points, are driven by complexity rather than size.
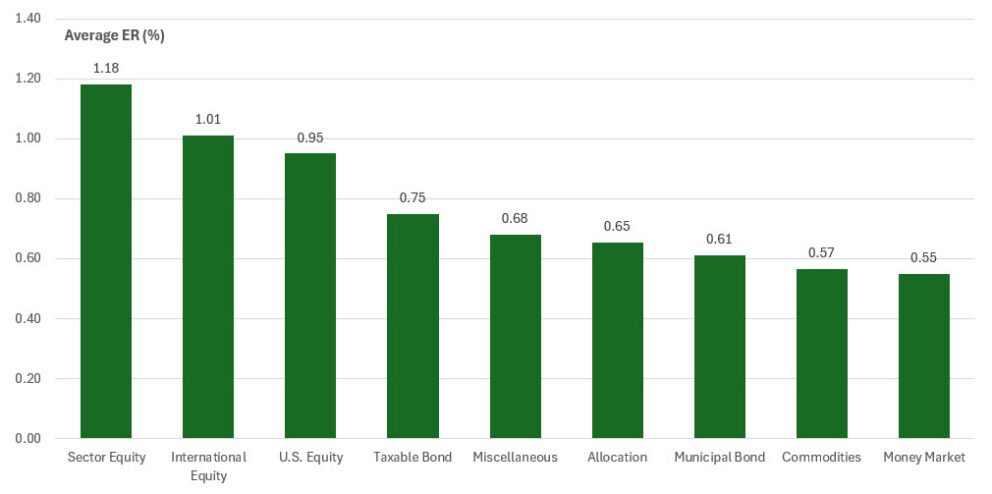
Notes of Explanation: Average (arithmetic average) expense ratio calculated across funds and share classes. Sources: Morningstar, fund documents and Sustainable Research and Analysis LLC.
Observations:
Actively managed, labeled-sustainable funds and ETFs (including money market funds/share classes) span 827 funds and share classes and roughly $203.9 billion in assets across nine broad Morningstar-style categories. Evaluating expense ratio data by category tells a clear story about where cost is driven by complexity rather than size, and where fee competition has already taken hold.
• Cost tracks complexity and mandate, not category size. Sector Equity is the smallest major slice of assets (2.5% of the total) but carries the highest average fee at 1.18%, nearly a third above the U.S. Equity average. International Equity, the second-priciest broad category at 1.01%, is also sizable ($32.4 billion). Meanwhile, the largest asset pools, consisting of U.S. Equity (53% of assets) and Taxable Bond (20%), sit closer to or below the overall average. Scale alone doesn’t buy investors a discount; the nature of the mandate does more of the work.
• Target-date pricing reflects a competitive, fiduciary-scrutinized market, not a sustainable-investing bargain. Sustainable target-date share classes average 0.56% versus 0.97% for the rest of the Allocation category (global aggressive/moderate blends and similar multi-asset funds). That gap is best read as the target-date market doing what it does industry-wide: retirement-plan fiduciaries and consultants scrutinize target-date fees closely, and the category is intensely competitive on price as a result, sustainable or not. It’s also a shrinking corner of the space, sustainable target-date assets are modest (many lineups hold just a few million dollars each), consistent with limited uptake and offerings that have struggled to gain traction rather than a deliberate low-fee push tied to sustainability.
• The priciest individual niches sit at the intersection of “active” and “narrow.” Health sector funds top the list at 1.67%, followed by a fixed-income specialty, Securitized Bond–Diversified, at 1.56%, and Technology sector funds at 1.51%. It’s a reminder that a specialized, high-conviction bond mandate can carry a fee more typical of an equity fund.
• The cheapest niches are short-duration or hedged fixed income, but on thin sample sizes. Global Bond–USD Hedged (0.22%, 4 funds/share classes) and Ultrashort Bond (0.43%, 12 funds/share classes) are the two least expensive sub-categories, alongside Muni National Short (0.20%, just 1 fund). The direction, stripping out currency and duration risk tends to strip out fee premium too, is plausible, but with so few offerings in each of these niches, a single new or closed fund could move the average meaningfully. These figures are better read as suggestive than definitive.
• The cheapest niches are short-duration or hedged fixed income. Global Bond–USD Hedged (0.22%) and Ultrashort Bond (0.43%) are the two least expensive sub-categories, alongside Muni National Short (0.20%, though just one fund). Stripping out currency and duration risk appears to strip out fee premium as well.
• Bigger pools of assets are not, on average, cheaper pools. The simple average expense ratio across all 827 funds/share classes is 0.855%. Weight that same set of funds by assets instead, and the average actually rises slightly to about 0.87%. That’s a reversal of the usual “economies of scale” pattern in fund pricing. It happens here because the largest asset pools sit in International and large-cap U.S. Equity funds priced at or above the overall average, not concentrated in the cheapest categories like money market or short municipal bond funds.