

Sustainable Bottom Line: With 30-year U.S. Treasury yields marching higher, sustainable taxable bond funds tell a clear story regarding the impact of duration and yields.
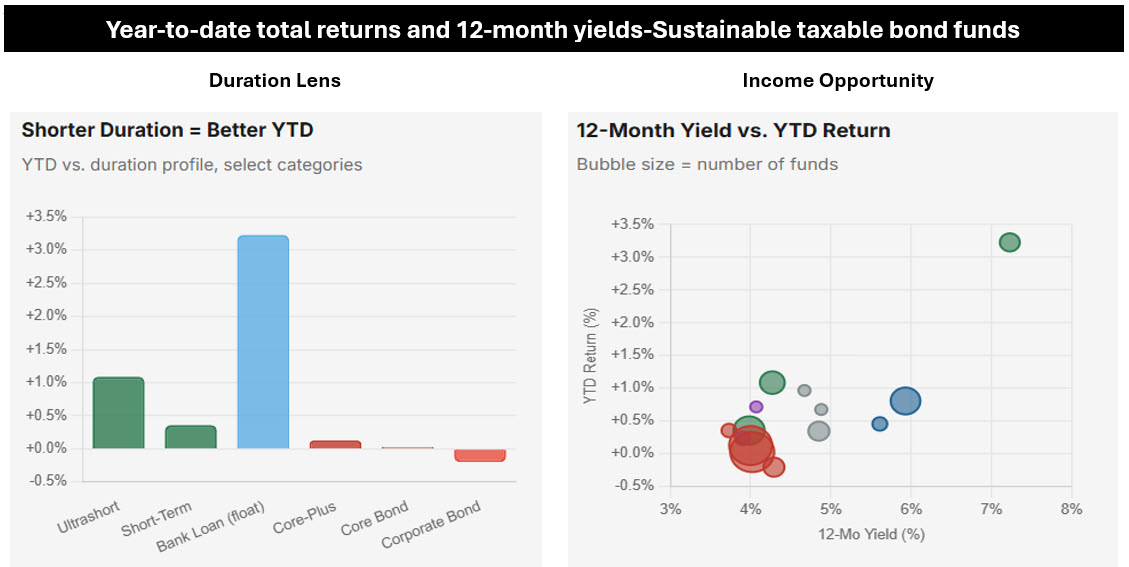
Notes of Explanation: Left hand chart displays average total returns Y-T-D for selected long-term sustainable taxable fund categories, as defined by Morningstar. Right hand chart displays Y-T-D average total returns versus 12-month average yields for 15 taxable fixed income fund categories. Data to April 30, 2026. Sources: Morningstar and Sustainable Research and Analysis LLC
Observations:
• The relationship between interest rate sensitivity and the year-to-date performance of labeled sustainable long-term fixed income funds (excluding money market funds) is notable in data through the end of April 2026. As the 30-year U.S. Treasury yield has climbed on renewed inflation fears (reaching over 5% as of May 22), fueled by rising fuel prices and ongoing fiscal concerns, fixed income categories carrying the greatest duration exposure have been hardest hit. Intermediate Core Bond funds, the largest segment with 44 sustainable offerings, including share classes of mutual funds, gained a mere 0.03% on the year, while their Core-Plus counterparts are barely ahead at 0.13%. Both groups offer, on average, 4.0% yields, meaningful income, but barely enough to offset price erosion so far in 2026.
• By contrast, the categories least exposed to interest rate movements are leading the pack. Bank Loan funds, whose coupons float with short-term reference rates, have returned an average 3.23% year-to-date, more than ten times the Core Bond category’s gain. Ultrashort Bond funds are next at +1.09%, followed by High Yield at +0.81%. The message is clear: in a rising-rate environment, duration is a liability, and investors in the largest sustainable bond categories have felt that acutely.
• The 2026 divergence is not only about duration. It also reflects the ongoing appetite for credit risk in a still-resilient economy. High Yield Bond funds delivered a 7.80% trailing average 12-month return on average, the second highest among traditional categories, while carrying an average yield of 5.93%. Securitized Bond funds (5.53% 12-month return) and Multisector strategies (5.63%) have similarly benefited from their credit exposure. Meanwhile, investment-grade Corporate Bond funds, carrying rate sensitivity alongside credit risk, have dipped into negative territory for the year (-0.20%), as their duration exposure has outweighed the credit tailwind.
• Bank Loans offer the most compelling combination: a floating-rate structure that immunizes against rising yields, plus a 7.23% current yield. It is worth noting, however, that the sustainable universe of bank loan funds remains small, just two funds offered by Calvert and Invesco via nine share classes that are richly priced based on their expense ratios.
• No category stands apart more sharply than Emerging-Markets Local-Currency Bond, which has posted an extraordinary 17.86% trailing 12-month return and a 9.56% average yield. Year-to-date, the group is up 1.11%, despite the difficult global environment. The gains reflect a confluence of factors: dollar weakness versus selected emerging market currencies, elevated local yields that compress bond prices, and commodity tailwinds benefiting sovereign issuers in Latin America and Southeast Asia. The sustainable emerging markets local-currency offerings, however, are comprised of only one Templeton fund with five share classes and higher than average expense ratios. It is a small and volatile corner of the market and investors drawn to the yield and recent returns should weigh currency risk and liquidity carefully.
• For all the price pressure in the intermediate and long segments of the sustainable bond market, a meaningful silver lining exists: yields across virtually every category are at multi-year highs. Even the embattled Intermediate Core Bond category offers a 4.02% average 12-month yield, more than double what similar funds were paying just four years ago. Short-Term Bond funds yield 3.98% with minimal price volatility. High Yield funds are producing 5.93%, and Bank Loans 7.23%.
• For long-horizon investors, this income buffer matters. A fund yielding 4% needs its price to fall by more than 4% annually before the total return turns negative, a significant cushion compared to the near-zero yields that plagued bond investors through much of the 2010s. The question of whether current yields adequately compensate for duration risk depends heavily on investors’ views of the inflation outlook. Those who believe rates will stabilize or fall can expect meaningful price appreciation on top of today’s income.
• The labeled sustainable fixed income landscape in mid-2026 presents investors with choices and trade-offs–even given limitations in terms of fund managers, number of fund offerings and fund categories. Those seeking to minimize further interest rate risk may wish to tilt toward shorter-duration categories, like Ultrashort and Short-Term funds or consider the Bank Loan segment’s floating-rate exposure, despite its limited fund offerings. An alternative approach for sustainable investors comfortable with a sustainable investing approach such as ESG integration that is explicitly practiced firm-wide by leading investment managers with conventional fund offerings, such as BlackRock and PIMCO, to mention just two, is to consider their Bank Loan product offerings. Investors comfortable with credit risk may find the High Yield and Securitized segments attractive on a yield-adjusted basis. Those with a longer time horizon may see current intermediate yields as an opportunity to lock in income that was unavailable for most of the last decade. In all cases, the data underscore the importance of understanding duration, not just yield, when evaluating sustainable bond funds in an environment where the direction of rates remains the central variable.