


Sustainable Bottom Line: Recent outperformance of sustainable ETFs versus mutual funds is attributable to variations in product offerings and investment exposures to higher performing sectors.
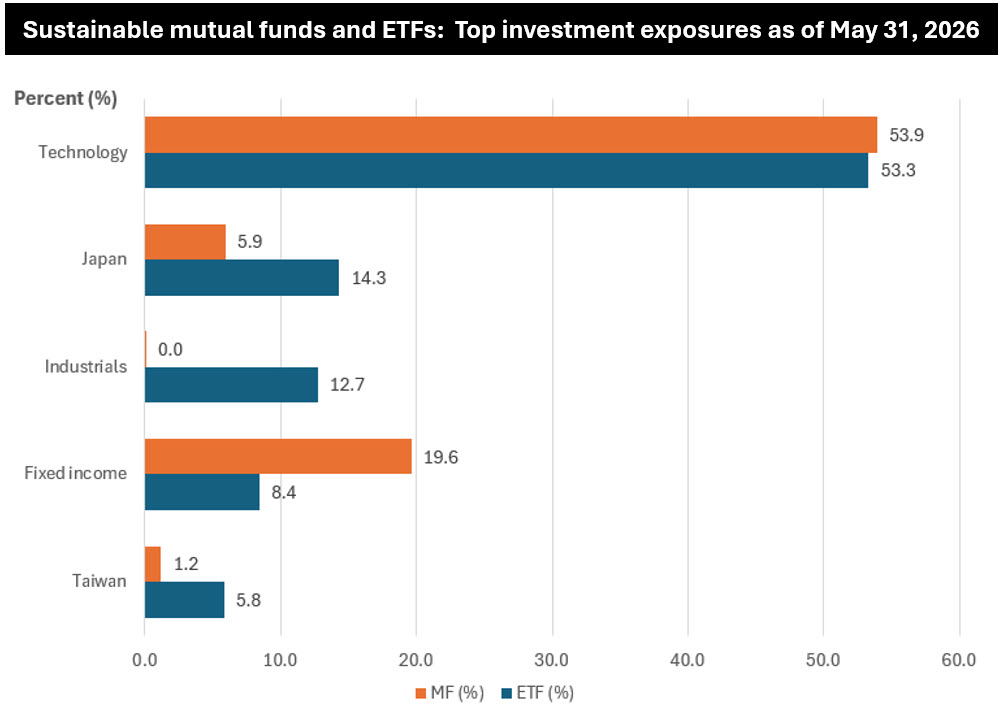
Notes of Explanation: The top five exposures are anchored based on holdings by ETFs as of May 31, 2026. Fixed income includes corporate bonds, government and government related issues, mortgage-backed and asset-backed bonds as well as municipal securities, where these are held. Sources: Morningstar and Sustainable Research and Analysis LLC.
Observations:
• In the aggregate, the average performance of labeled sustainable ETFs in May and over the trailing twelve months exceeded the performance of similarly classified mutual funds by significant margins. 187 ETFs posted average gains of 4.7% in May and 37.0% during the preceding twelve months while 384 mutual funds (consisting of 834 share classes) recorded average gains of 2.9% and 20.7%, respectively*. That’s 1.6X and 1.8X better over the two-time intervals. By way of context, at the end of May, when the combined total of long-term sustainable mutual funds and ETFs reached $403.3 billion in net assets, mutual funds accounted for $242.2 billion in asserts while ETFs held $161.1 billion, or 40% of the total up from 33% some twelve months earlier.
• The recent outperformance of sustainable ETFs versus mutual funds is in large part attributable to variations in the composition of product offerings which, as a result, led in recent years to a greater proportion of investments in higher performing equities and higher performing sectors. At the end of May, ETF offerings were dominated by US Equity funds (52.3%), Sector Equity funds (16%) and International Equity funds (23%), for a combined 91.3% total allocation to stocks versus a 77% allocation to stocks by long-term sustainable mutual funds, consisting of US Equity funds (60%), Sector Equity funds (2%) and International Equity funds (15%). Bond funds account for 18% of net assets versus around 8% for ETFs. In turn, at least three notable investment allocation factors with differences of 5% or more help explain the performance gap. These include fixed income overweightings, geographic tilts, and sector exposures.
• While both investment product offerings maintained similar exposure levels to the technology sector, one of the best performing sectors during the trailing one-year interval, a big drag on the average performance of mutual funds can be traced to their greater proportion of fixed income product offerings and relatively larger average exposure to fixed income securities, including corporate bonds (8.4%), government and government related issues (4.02%), mortgage-backed and asset-backed bonds (6.2%) as well as municipal securities (0.8%). On a combined basis, ETFs registered an exposure of 8.4% to fixed income versus 19.6% for mutual funds, or a level twice as high. During a period when equities dramatically outperformed bonds, which is precisely what the trailing 12-month numbers reflect (average 30.85% for stock funds versus 5.6% for bond funds), this investment tilt meaningfully suppressed mutual funds averages.
• Its increased offerings in the International Equity funds segment elevated the exposure of ETFs to Japanese stocks which amplified their outperformance. ETFs carry 14.3% of assets in Japan versus 5.9% for mutual funds. Japanese equities had a strong run during this period, so the ETF universe got an outsized boost from this geographic tilt.
• Greater exposure to industrials via stock holdings also served to magnify the performance of ETFs. ETFs reflected an average 12.7% share while the exposure to industrials by mutual funds stood at 4.5% at a time when over the previous twelve months industrials were up around 32%.
• While other factors, structural and otherwise, likely contributed to the over and under performance of mutual funds when compared to ETFs, for example, the proportion of index tracking funds versus actively managed funds, holdings of cash and cash equivalents, flows, turnover, and expense ratios, to mention some, key factors are the variations in the composition of product offerings and investment exposures to higher performing asset classes and sectors.
*While the variations are not as dramatic, in 2022 when US and international stocks underperformed bonds, which also posted negative returns, sustainable mutual funds outperformed ETFs -17% to -18.7%.