


Sustainable Bottom Line: Labeled sustainable index fund assets crossed a milestone in September to eclipse actively managed fund assets, based on assets of $392.2 billion.
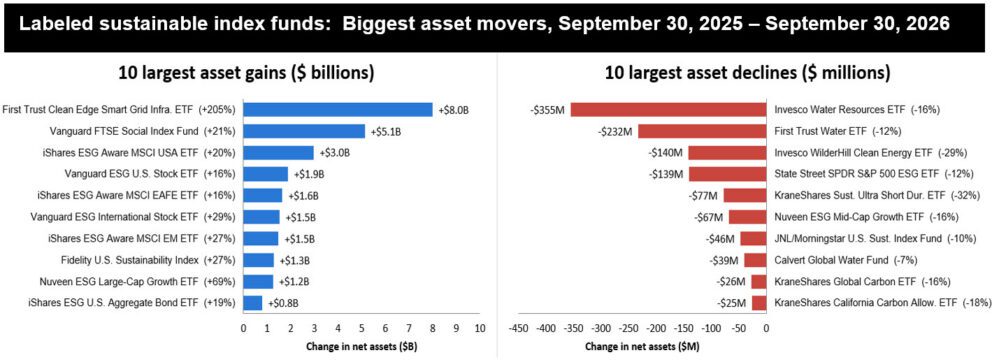
Notes of Explanation: Change in net assets apply to funds (in the case of mutual funds with multiple share classes, share classes are combined), % change relative to 9/30/2025. Sources: Morningstar and Sustainable Research and Analysis LLC.
Observations:
• Labeled sustainable index funds crossed a milestone over the 12 months ended September 30, 2026, based on an analysis of long-term assets attributable to 972 labeled sustainable long-term funds/share classes that reached $392.2 billion in assets as of September 30, 2026. Their share of labeled sustainable fund assets rose to 50.3% from 42.9% a year earlier, overtaking actively managed funds. Net assets of index tracking funds climbed $37.1 billion, or 22.8%, to $199.9 billion, even as the number of funds and share classes fell from 188 to 171 (1).
• The asset gains, though, were anything but broad-based. The 10 funds (after combining mutual fund share classes where applicable) with the largest increases added $25.8 billion, or 70% of the total. The First Trust NASDAQ Clean Edge Smart Grid Infrastructure ETF (GRID) alone accounted for nearly $8.0 billion, more than a fifth of the increase. Its assets tripled to $11.9 billion, lifting it from 11th to 5th largest. With a 12-month return of 18.6%, most of that gain came from new money, a sign of investor interest in the power-grid buildout tied to AI data centers. Eight of the other nine are large, low-cost broad-market equity index funds from Vanguard, iShares, Fidelity and Nuveen, led by the Vanguard FTSE Social Index Fund (VFTAX, VFTNX) (+$5.1 billion across its two share classes). Their growth largely tracked market returns. The exception is the iShares ESG U.S. Aggregate Bond ETF (EAGG), the only bond fund in the group, which added $777 million despite a -1.9% return, all of it from new money.
• Apart from the thematic smart grid ETF, the top gainers are broad-market index funds that combine exclusions with ESG-score tilts or best-in-class selections while the Vanguard ESG U.S. Stock ETF (ESGV) also offers investors a proxy voting choice. The index tracked by GRD offers investors exposure to companies that are primarily engaged and involved in electric grid, electric meters, devices and networks, energy storage and management, connected mobility, and enabling software used by the smart grid and electric infrastructure sector. ESG considerations are not a factor in the investment decisions.
• The 10 largest decliners lost a combined $1.1 billion, less than 5% of the top 10 gains. Water funds took the top two spots: the Invesco Water Resources ETF (PHO) (-$355 million) and the First Trust Water ETF (FIW) (-$232 million), both of which posted negative 12-month returns. A third, the Calvert Global Water Fund (CFWAX, CFWCX, CFWIX), also made the list. Clean energy and carbon allowance funds round out the list.
• Growth came from markets and new money. It is estimated that roughly $23.5 billion of the asset increase in continuing funds came from market appreciation and about $14.0 billion from net inflows, about half of it into the smart grid ETF.
• Concentration increased. The 10 largest funds now hold 58.2% of index fund assets, up from 56.4%. The Vanguard FTSE Social Index Fund remains the largest, at $29.5 billion across its two share classes.
• The list is thinning at the small end. Funds with less than $10 million in assets fell from 21 to 11, and the median fund size rose to $264 million from $166 million.
• Returns were similar on average but more widely dispersed. The average 12-month return, based on each fund’s largest share class, was 12.9% versus 13.1% a year earlier, but 23 funds posted losses, up from five. Returns ranged from 126.7% (Xtrackers Semiconductor Select Equity ETF (CHPS)) to -31.4% (KraneShares MSCI China Clean Tech ETF (KGRN)).
• Fees held steady. The asset-weighted expense ratio was unchanged at 0.21%. The Vanguard FTSE Social Index Institutional share class cut its expense ratio to 0.03% from 0.07%.
• A broad-market ESG ETF lost assets despite a strong return. The State Street SPDR S&P 500 ESG ETF (EFIV) lost 12% of its assets despite a 17.6% return, which points to an estimated $340 million in net outflows.
(1) Combining share classes, the list shrinks from 161 funds to 148. Exits totaled 21 funds/share classes (16 funds) with $862 million a year ago, versus four additions with $456 million, one a new share class of an existing fund. Six exits were share classes of the Invesco MSCI World SRI Index, and four were iShares ESG Aware allocation ETFs. Another 19 funds changed names, mostly due to sponsor rebranding.