The Bottom Line: Stocks and bonds eked out gains in May while the relative performance of selected sustainable equity and bond indices trailed conventional benchmarks.
The broad stock market, as measured by the S&P 500 Index, briefly traded in bear market territory but managed to eke out a narrow 0.39% gain in May
The broad stock market, as measured by the S&P 500 Index, managed to eke out a narrow 0.39% gain in May but not before hitting an intraday bear market signal on May 20th as concerns mounted that consumers were slowing on spending due to higher prices and a growing belief that the Fed’s interest rate increases would be quicker and more pronounced than expected. The S&P 500 recorded eight down days through May 19th, with three of these reaching 3 and 4 percentage points. In the end, however, the market rebounded on the basis of some optimism that inflation may have peaked and the underlying economy was still strong enough to support spending and contribute to corporate profits. The Dow Jones Industrial Average (DJIA) also closed on the positive side, adding 0.33% while the NASDAQ Composite posted a drop of -1.93%. Small cap stocks trailed large caps by a narrow 3 bps margin based on the Russell 2000 while value outperformed growth stocks. For the trailing 12-months, the S&P 500, DJIA and NASDAQ Composite are down -0.3%, -1.66% and -6.96%, respectively.
Overseas equity markets also ended the month higher, with the MSCI ACWI, ex USA Index, MSCI EAFE Index and MSCI Emerging Markets Index recording positive results of 0.72%, 0.75% and 0.47%, respectively.
Bonds also came in higher, registering a gain of 0.27%, as 10-year Treasury note yields, that moved from 2.89% to 2.85% at the end of May, remained largely unchanged. This was the first positive monthly result after nine successive monthly drops that left the Bloomberg US Aggregate Bond Index down by 13.21% for the trailing twelve-month interval.
Chart 1: S&P 500 Index cumulative price only rates of return-May 2022
Source: Yahoo Finance
Sustainable mutual funds and ETFs posted an average return of -0.16%
The universe of sustainable mutual funds and ETFs, a total of 1,320 funds as of May 31, 2022, posted an average total return of -0.16%. Returns ranged from a low of -8.28%, recorded by the Spear Alpha ETF, an actively managed fund that invests primarily in equities of companies that Spear Advisors LLC (SPRX) believes are poised to benefit from breakthrough innovation in industrial technology, to a high of 14.51% posted by Global X Solar ETF (RAYS). Refer to Table 1a and 1b.
Table 1a: Top 10 performing funds Table 1b: Bottom 10 performing funds
Fund Name | 1-Month TR (%) | 12-Month TR (%) | Fund Name | 1-Month TR (%) | 12-Month TR (%) |
Global X Solar ETF | 14.51 | | Direxion World Without Waste ETF | -6.83 | -24.11 |
Invesco Solar ETF | 10.59 | -10.07 | Alger Weatherbie Enduring Growth C | -6.94 | |
Direxion Dl Glbl Clean Ey Bull 2X Shrs | 9.24 | | Global X Hydrogen ETF | -7.01 | |
KraneShares MSCI China Clean Tech ETF | 9.05 | -12.64 | Defiance Next Gen H2 ETF | -7.42 | -45.09 |
SPDR® Kensho Clean Power ETF | 8.14 | -16.92 | Eventide Exponential Technologies A | -7.9 | -29.73 |
GMO Climate Change III | 7.17 | -2.19 | Eventide Exponential Technologies I | -7.94 | -29.66 |
GMO Climate Change I | 7.16 | -2.37 | Eventide Exponential Technologies N | -7.97 | -29.79 |
GMO Climate Change R6 | 7.15 | 6.12 | Eventide Exponential Technologies C | -8 | -30.33 |
ProShares S&P Kensho Cleantech ETF | 6.98 | | ETFB Green SRI REITs ETF | -8.09 | |
First Trust NASDAQ® Cln Edge® GrnEngyETF | 6.92 | -10.7 | Spear Alpha ETF | -8.28 | |
Notes of Explanation: Performance covering both mutual funds and ETFs=total returns in percentage terms for periods ending May 31, 2022. 1-M=1 month, 12-M=12 months. Blank cells=fund was not in operation during entire interval. Source: Morningstar Direct.
Relative performance of sustainable equity and bond indices trailed conventional benchmarks following two consecutive months of improvement
Based on a selected set of MSCI stock oriented ESG Leaders indices and one ESG Focus bond index, the relative performance of the six indices slid back in May as all six benchmarks underperformed their conventional counterparts.
Adding the large cap S&P 500 ESG Index to the mix of ESG indices introduces a positive exception to the relative MSCI index results achieved in May as the index outperformed its conventional S&P 500 benchmark by 21 bps. It also outperformed the MSCI USA ESG Leaders Index by a wide 1.06% due to the lower exposures to medium and small cap stocks, a 3.1% greater allocation to the energy sector and lower levels of concentration in individual technology names that didn’t perform as well in May.
With the exception of the MSCI USA Small Cap ESG Leaders Index and the 10-year record posted by the MSCI USA ESG Leaders Index, the intermediate and long-term track records of selected sustainable bond and stock benchmarks continue to outperform. Refer to Chart 2.
Chart 2: Selected sustainable indices intermediate and long-term relative total return performance results to May 31, 2022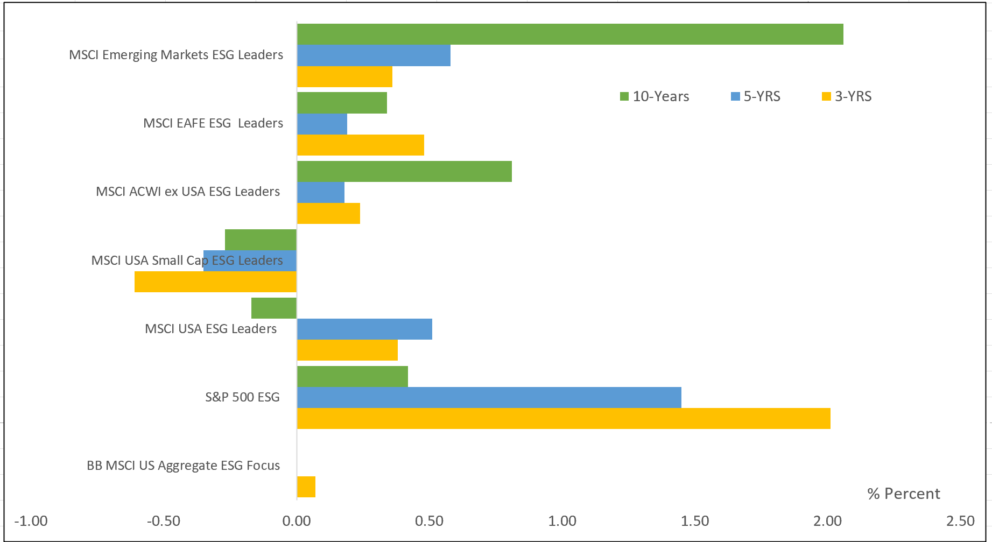
Notes of Explanation: MSCI equity indices are the ESG Leaders indices while fixed income is ESG Focus. Blanks indicate performance results are not available. Intermediate and long-term results include 3-5-and 10-year returns that are expressed as average annual returns. MSCI USA Small Cap returns are price only. Sources: MSCI, S&P Global, Sustainable Research and Analysis LLC.
SRA Select List of funds posted an average increase of 0.43% in May
Reversing course from last month, SRA Select funds, posted an average increase of 0.43% in May versus an average 0.27% registered by the average performance of corresponding conventional benchmarks¹. Excluding money market funds, returns ranged from high of 1.52% recorded by the iShares ESG Aware MSCI EAFE ETF (ESGD) to a low of -0.65% posted by the iShares MCI KLD 400 Social ETF (DSI). Refer to Table 2 for a complete rundown of SRA Select list of mutual funds and ETFs and their April performance results.
Consisting² of nine funds pursuing discrete investment strategies intend for use as building blocks in the creation of a diversified ESG-oriented portfolio, only two of the nine funds outperformed their conventional benchmarks in April (Refer to previously published article SRA Select Listing: ESG Integration Investment Fund Q1-2022 https://sustainableinvest.com/sra-select-listing-esg-integration-investment-funds-q1-2022/
¹To avoid duplications, these average results exclude the Vanguard Treasury Money Market Fund and the S&P 500 Index.
²A tenth fund, the Vanguard Treasury Money Market Fund, is an alternative money market fund.
Table 2: Performance of SRA Select listed mutual funds and ETFs-May 2022
Fund name/Index | Expense Ratio (%) | Assets ($ M) | 1-Month Total Return (%) | 3-Month Total Return (%) | 12-Month Total Return (%) | 3-Year Average TR (%) |
iShares ESG Advanced Hi Yld Corp Bd ETF (HYXF) | 0.35 | 156.6 | 1.04 | -3.84 | -5.85 | 2.47 |
iShares ESG Aware MSCI EAFE ETF (ESGD) | 0.2 | 7,151.8 | 1.52 | -4.93 | -10.98 | 6.92 |
iShares ESG Aware MSCI USA Small-Cap ETF (ESML) | 0.17 | 1,464.7 | -0.1 | -7.55 | -12.04 | 12.44 |
iShares ESG U.S. Aggregate Bond ETF (EAGG) | 0.1 | 1,957.2 | 0.61 | -5.86 | -8.28 | -0.08 |
iShares MSCI ACWI Low Carbon Target ETF (CRBN) | 0.2 | 1,023.4 | 0.1 | -6.19 | -7.4 | 11.93 |
iShares MSCI KLD 400 Social ETF (DSI) | 0.25 | 3,820.0 | -0.65 | -6.76 | -2.14 | 16.80 |
iShares USD Green Bond ETF (BGRN) | 0.2 | 274.7 | 0.51 | -5.78 | -9.36 | -0.87 |
iShares® ESG MSCI EM Leaders ETF (LDEM) | 0.16 | 66.0 | 0.78 | -7.56 | -20 | |
BlackRock Liquid Environmentally Aware Inv A (LEAXX) | 0.45 | 1,246.6 | 0.04 | 0.03 | -0.01 | 0.49 |
Vanguard Treasury Money Market Fund Investor (VUSXX) | 0.09 | 34,951.6 | 0.05 | 0.09 | 0.10 | 0.57 |
Averages* | 0.23 | | 0.43 | -5.38 | -8.45 | 6.26 |
S&P 500 Index | | | 0.18 | -5.16 | -0.3 | 16.44 |
MSCI USA Index | | | -0.22 | -6.07 | -2.28 | 16.28 |
MSCI USA Small Cap Index | | | -0.00 | -7.41 | -12.84 | 10.52 |
MSCI EAFE Index | | | 0.75 | -5.16 | -10.38 | 6.53 |
MSCI ACWI Index | | | 0.12 | -5.9 | -6.78 | 11.71 |
MSCI Emerging Markets Index | | | 0.44 | -7.29 | -19.83 | 5.00 |
Bloomberg U.S. Treasury Bill (1-3 M) | | | 0.05 | 0.09 | 0.12 | 0.63 |
Bloomberg U.S. Aggregate Bond Index | | | 0.64 | -5.86 | -8.22 | 0.0 |
Bloomberg U.S. Corporate High Yield Index | | | 0.25 | -4.43 | -5.27 | 3.33 |
S&P Green U.S. Dollar Select Index | | | 0.4 | -5.15 | -9.16 | 0.09 |
Averages** | | | 0.27 | -5.24 | -8.29 | 6.75 |
Notes of Explanation: Assets=Net Assets in millions. Blank cells=fund was not in operation during entire interval. *Average returns exclude the Vanguard Treasury Money Market Fund Investor. **Average returns exclude the S&P 500 Index to avoid double counting. Sources: Morningstar Direct and MSCI.
Stocks and bonds recorded gains of 0.39% and 0.27% in May
The Bottom Line: Stocks and bonds eked out gains in May while the relative performance of selected sustainable equity and bond indices trailed conventional benchmarks. The broad stock market, as measured by the S&P 500 Index, briefly traded in bear market territory but managed to eke out a narrow 0.39% gain in May
Share This Article:
The Bottom Line: Stocks and bonds eked out gains in May while the relative performance of selected sustainable equity and bond indices trailed conventional benchmarks.
The broad stock market, as measured by the S&P 500 Index, briefly traded in bear market territory but managed to eke out a narrow 0.39% gain in May
The broad stock market, as measured by the S&P 500 Index, managed to eke out a narrow 0.39% gain in May but not before hitting an intraday bear market signal on May 20th as concerns mounted that consumers were slowing on spending due to higher prices and a growing belief that the Fed’s interest rate increases would be quicker and more pronounced than expected. The S&P 500 recorded eight down days through May 19th, with three of these reaching 3 and 4 percentage points. In the end, however, the market rebounded on the basis of some optimism that inflation may have peaked and the underlying economy was still strong enough to support spending and contribute to corporate profits. The Dow Jones Industrial Average (DJIA) also closed on the positive side, adding 0.33% while the NASDAQ Composite posted a drop of -1.93%. Small cap stocks trailed large caps by a narrow 3 bps margin based on the Russell 2000 while value outperformed growth stocks. For the trailing 12-months, the S&P 500, DJIA and NASDAQ Composite are down -0.3%, -1.66% and -6.96%, respectively.
Overseas equity markets also ended the month higher, with the MSCI ACWI, ex USA Index, MSCI EAFE Index and MSCI Emerging Markets Index recording positive results of 0.72%, 0.75% and 0.47%, respectively.
Bonds also came in higher, registering a gain of 0.27%, as 10-year Treasury note yields, that moved from 2.89% to 2.85% at the end of May, remained largely unchanged. This was the first positive monthly result after nine successive monthly drops that left the Bloomberg US Aggregate Bond Index down by 13.21% for the trailing twelve-month interval.
Chart 1: S&P 500 Index cumulative price only rates of return-May 2022
Source: Yahoo Finance
Sustainable mutual funds and ETFs posted an average return of -0.16%
The universe of sustainable mutual funds and ETFs, a total of 1,320 funds as of May 31, 2022, posted an average total return of -0.16%. Returns ranged from a low of -8.28%, recorded by the Spear Alpha ETF, an actively managed fund that invests primarily in equities of companies that Spear Advisors LLC (SPRX) believes are poised to benefit from breakthrough innovation in industrial technology, to a high of 14.51% posted by Global X Solar ETF (RAYS). Refer to Table 1a and 1b.
Table 1a: Top 10 performing funds Table 1b: Bottom 10 performing funds
Fund Name
1-Month TR (%)
12-Month TR (%)
Fund Name
1-Month TR (%)
12-Month TR (%)
Global X Solar ETF
14.51
Direxion World Without Waste ETF
-6.83
-24.11
Invesco Solar ETF
10.59
-10.07
Alger Weatherbie Enduring Growth C
-6.94
Direxion Dl Glbl Clean Ey Bull 2X Shrs
9.24
Global X Hydrogen ETF
-7.01
KraneShares MSCI China Clean Tech ETF
9.05
-12.64
Defiance Next Gen H2 ETF
-7.42
-45.09
SPDR® Kensho Clean Power ETF
8.14
-16.92
Eventide Exponential Technologies A
-7.9
-29.73
GMO Climate Change III
7.17
-2.19
Eventide Exponential Technologies I
-7.94
-29.66
GMO Climate Change I
7.16
-2.37
Eventide Exponential Technologies N
-7.97
-29.79
GMO Climate Change R6
7.15
6.12
Eventide Exponential Technologies C
-8
-30.33
ProShares S&P Kensho Cleantech ETF
6.98
ETFB Green SRI REITs ETF
-8.09
First Trust NASDAQ® Cln Edge® GrnEngyETF
6.92
-10.7
Spear Alpha ETF
-8.28
Notes of Explanation: Performance covering both mutual funds and ETFs=total returns in percentage terms for periods ending May 31, 2022. 1-M=1 month, 12-M=12 months. Blank cells=fund was not in operation during entire interval. Source: Morningstar Direct.
Relative performance of sustainable equity and bond indices trailed conventional benchmarks following two consecutive months of improvement
Based on a selected set of MSCI stock oriented ESG Leaders indices and one ESG Focus bond index, the relative performance of the six indices slid back in May as all six benchmarks underperformed their conventional counterparts.
Adding the large cap S&P 500 ESG Index to the mix of ESG indices introduces a positive exception to the relative MSCI index results achieved in May as the index outperformed its conventional S&P 500 benchmark by 21 bps. It also outperformed the MSCI USA ESG Leaders Index by a wide 1.06% due to the lower exposures to medium and small cap stocks, a 3.1% greater allocation to the energy sector and lower levels of concentration in individual technology names that didn’t perform as well in May.
With the exception of the MSCI USA Small Cap ESG Leaders Index and the 10-year record posted by the MSCI USA ESG Leaders Index, the intermediate and long-term track records of selected sustainable bond and stock benchmarks continue to outperform. Refer to Chart 2.
Chart 2: Selected sustainable indices intermediate and long-term relative total return performance results to May 31, 2022
Notes of Explanation: MSCI equity indices are the ESG Leaders indices while fixed income is ESG Focus. Blanks indicate performance results are not available. Intermediate and long-term results include 3-5-and 10-year returns that are expressed as average annual returns. MSCI USA Small Cap returns are price only. Sources: MSCI, S&P Global, Sustainable Research and Analysis LLC.
SRA Select List of funds posted an average increase of 0.43% in May
Reversing course from last month, SRA Select funds, posted an average increase of 0.43% in May versus an average 0.27% registered by the average performance of corresponding conventional benchmarks¹. Excluding money market funds, returns ranged from high of 1.52% recorded by the iShares ESG Aware MSCI EAFE ETF (ESGD) to a low of -0.65% posted by the iShares MCI KLD 400 Social ETF (DSI). Refer to Table 2 for a complete rundown of SRA Select list of mutual funds and ETFs and their April performance results.
Consisting² of nine funds pursuing discrete investment strategies intend for use as building blocks in the creation of a diversified ESG-oriented portfolio, only two of the nine funds outperformed their conventional benchmarks in April (Refer to previously published article SRA Select Listing: ESG Integration Investment Fund Q1-2022 https://sustainableinvest.com/sra-select-listing-esg-integration-investment-funds-q1-2022/
¹To avoid duplications, these average results exclude the Vanguard Treasury Money Market Fund and the S&P 500 Index.
²A tenth fund, the Vanguard Treasury Money Market Fund, is an alternative money market fund.
Table 2: Performance of SRA Select listed mutual funds and ETFs-May 2022
Fund name/Index
Expense Ratio (%)
Assets
($ M)
1-Month Total Return (%)
3-Month Total Return (%)
12-Month Total Return (%)
3-Year Average TR (%)
iShares ESG Advanced Hi Yld Corp Bd ETF (HYXF)
0.35
156.6
1.04
-3.84
-5.85
2.47
iShares ESG Aware MSCI EAFE ETF (ESGD)
0.2
7,151.8
1.52
-4.93
-10.98
6.92
iShares ESG Aware MSCI USA Small-Cap ETF (ESML)
0.17
1,464.7
-0.1
-7.55
-12.04
12.44
iShares ESG U.S. Aggregate Bond ETF (EAGG)
0.1
1,957.2
0.61
-5.86
-8.28
-0.08
iShares MSCI ACWI Low Carbon Target ETF (CRBN)
0.2
1,023.4
0.1
-6.19
-7.4
11.93
iShares MSCI KLD 400 Social ETF (DSI)
0.25
3,820.0
-0.65
-6.76
-2.14
16.80
iShares USD Green Bond ETF (BGRN)
0.2
274.7
0.51
-5.78
-9.36
-0.87
iShares® ESG MSCI EM Leaders ETF (LDEM)
0.16
66.0
0.78
-7.56
-20
BlackRock Liquid Environmentally Aware Inv A (LEAXX)
0.45
1,246.6
0.04
0.03
-0.01
0.49
Vanguard Treasury Money Market Fund Investor (VUSXX)
0.09
34,951.6
0.05
0.09
0.10
0.57
Averages*
0.23
0.43
-5.38
-8.45
6.26
S&P 500 Index
0.18
-5.16
-0.3
16.44
MSCI USA Index
-0.22
-6.07
-2.28
16.28
MSCI USA Small Cap Index
-0.00
-7.41
-12.84
10.52
MSCI EAFE Index
0.75
-5.16
-10.38
6.53
MSCI ACWI Index
0.12
-5.9
-6.78
11.71
MSCI Emerging Markets Index
0.44
-7.29
-19.83
5.00
Bloomberg U.S. Treasury Bill (1-3 M)
0.05
0.09
0.12
0.63
Bloomberg U.S. Aggregate Bond Index
0.64
-5.86
-8.22
0.0
Bloomberg U.S. Corporate High Yield Index
0.25
-4.43
-5.27
3.33
S&P Green U.S. Dollar Select Index
0.4
-5.15
-9.16
0.09
Averages**
0.27
-5.24
-8.29
6.75
Notes of Explanation: Assets=Net Assets in millions. Blank cells=fund was not in operation during entire interval. *Average returns exclude the Vanguard Treasury Money Market Fund Investor. **Average returns exclude the S&P 500 Index to avoid double counting. Sources: Morningstar Direct and MSCI.
Sustainableinvest.com
Benefits
Free access to regularly updated original research and analysis focused exclusively on sustainable finance and investing, providing investors with the guidance needed to make informed investment decisions that align with their personal values and financial goals while also contributing to the advancement of positive long-term environmental and social outcomes.
By offering financial support for our current work, either in the form of a one-time or regular contributions, you help to defray some of the costs associated with conducting our research and analysis as well as to maintain the www.sustainableinvest.com website.
Helping us to expand our research capabilities and offerings over time to cover additional relevant topics geared to sustainable investors.
Sign up to free newsletters.
By submitting this form, you are consenting to receive marketing emails from: . You can revoke your consent to receive emails at any time by using the SafeUnsubscribe® link, found at the bottom of every email. Emails are serviced by Constant Contact