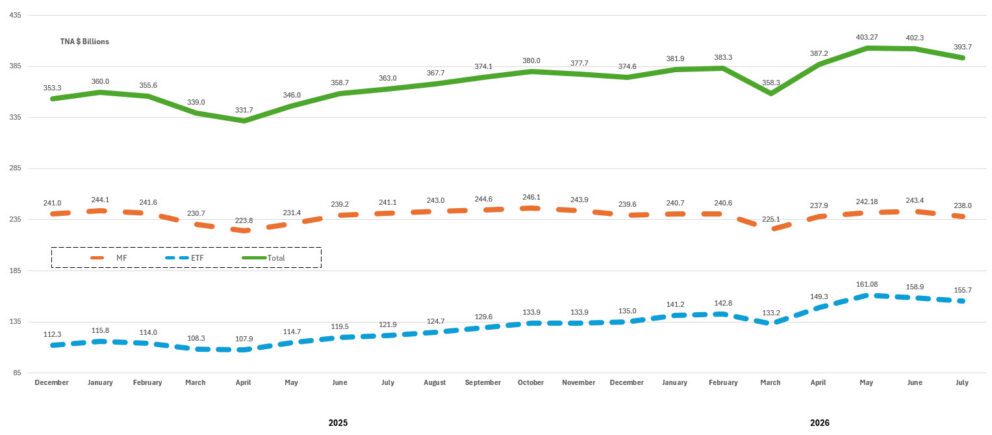
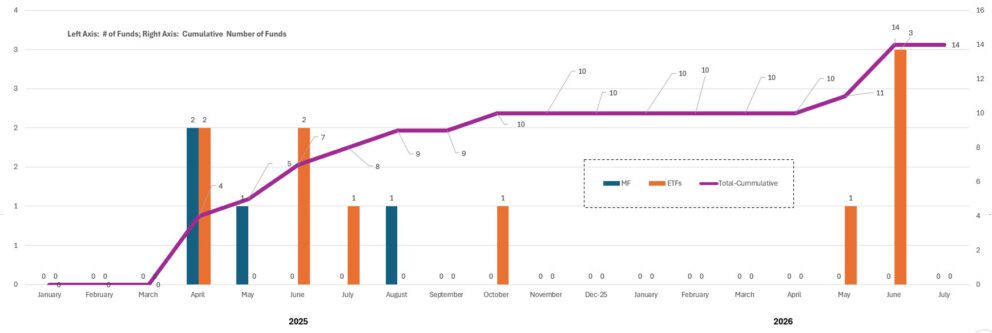
After recording three consecutive monthly gains in net assets that elevated labeled sustainable long-term funds above the $400 billion level, the segment, consisting of 997 mutual funds/share classes and ETFs, gave up $8.6 billion to end the month of July at $393.7 billion. Against a backdrop of flat to modestly lower equity prices and a sharper than average decline in bond returns, the assets of labeled sustainable long-term mutual funds gave up $5.4 billion to end July at $238.0 billion while ETFs dropped by $3.2 billion to end the month at $154.5 billion. In both cases the declines were due to market depreciation and net cash outflows, including fund liquidations. The funds count, including share classes, that dropped below the 1,000 level on a month-over-month basis, experienced a net decline of eight funds/share classes.
Using the back of the envelope calculation, long-term mutual funds experienced net cash outflows estimated at around $2.2 billion while ETFs recorded net cash outflows estimated at around $1.2 billion.
Since the start of the year, the assets of labeled long-term sustainable mutual funds and ETFs expanded by $19.1 billion, or an increase of 5.1% versus an average total return increase of 8.1% based on funds in operation at the end of July. |
A comprehensive July-August public data set has not been published yet, however, it is expected that green, social and sustainability bond issuances for the remainder of 2026 will be influenced by the following drivers:
-The AI and Electrification Surge: The massive capital needed to build AI-driven data centers and upgrade digital power grids has emerged as a major catalyst for new green corporate debt.
-The Refinancing Wave: An unprecedented volume of early-generation green bonds is maturing in 2026, forcing a major redemption and refinancing cycle primarily among European banks and quasi-sovereign issuers.
-Standardization over Expansion: Instead of chasing rapid volume growth, the market is shifting toward tighter transparency frameworks, specifically under the newly introduced European Green Bond Standard (EuGB).
-Regional Divergence: Europe continues to dominate the landscape, expected to command 42% of global issuance. Conversely, APAC, particularly China, is scaling up energy transition debt, while North American issuance faces slower growth.
In the meantime, there were several key issuances reported during the two-month period, including:
-Royal Philips: The Dutch multinational health technology company priced a EUR 650 million fixed-rate note due 2034, marking the healthcare industry’s first green bond under the new European Green Bond Standard.
-International Finance Corporation (IFC): Priced its inaugural EUR 1 billion 7-year green benchmark bond on July 8, 2026, following a $2 billion 5-year USD green benchmark on July 7, 2026.
-Klépierre: The French real-estate investment trust announced an 8-year green bond issuance of EUR 500 million due September 2034 with a coupon of 3.875%.
CTP: Europe’s industrial property developer placed a successful EUR 500 million green bond under its framework, admitted to trading on Euronext Dublin in late August 2026.
-Genova Property Group: Issued new senior unsecured floating rate green bonds totaling SEK 350 million as part of a capital structure optimization carrying through August 2026.
It is expected that green, social and sustainability bond issuances for the remainder of 2026 will be influenced by the following drivers:
-The AI and Electrification Surge: The massive capital needed to build AI-driven data centers and upgrade digital power grids has emerged as a major catalyst for new green corporate debt.
-The Refinancing Wave: An unprecedented volume of early-generation green bonds is maturing in 2026, forcing a major redemption and refinancing cycle primarily among European banks and quasi-sovereign issuers.
-Standardization over Expansion: Instead of chasing rapid volume growth, the market is shifting toward tighter transparency frameworks, specifically under the newly introduced European Green Bond Standard (EuGB).
-Regional Divergence: Europe continues to dominate the landscape, expected to command 42% of global issuance. Conversely, APAC—particularly China—is scaling up energy transition debt, while North American issuance faces slower growth.
Q2 recap (as published in July)
According to SIFMA, fixed income issuance in the U.S. decreased slightly in Q2 2026 to $3.2 trillion, or a decline of 1.7% on a quarter over quarter basis. Against this backdrop, U.S. sustainable debt (including green, social and sustainability bonds) issuance reached $40.1 billion versus $29.6 billion in Q1, for a Q/Q increase of $10.5 billion, or 35.4%. Compared to the second quarter of 2025, sustainable debt issuance expanded by $1.8 billion, for an increase of 4.7%. Sustainability bonds accounted for 52.5% of the issuance volume in the second quarter while green bonds and social bonds made up 40.7% and 6.8%, respectively. Since the start of the year, issuance of sustainable debt instruments in the U.S. reached $69.6 billion compared to last year’s $95.2 or a drop of 27%. A straight-line interpolation suggests that 2026 U.S. sustainable debt issuance could end up at around $139.2 billion, which would represent a decline of $45.1 billion, or a significant drop of 24%.
Worldwide, issuance also picked up momentum relative to Q2. Total issuance reached $287.8 billion in Q2, for a strong increase of $46.9 billion or 19.5%. Green bons accounted for 68.9% of issuance while sustainability and social bonds stood at 18.5% and 12.6%, respectively. Year-to-date, global sustainable debt reached $528.7 billion versus $467.6 billion registered during the first six months of the prior year, or an increase of $61.1 billion or 13%. A straight-line interpolation suggests that this year’s global issuance could exceed $1.0 trillion. |
Markets in Review. U.S. and international equities finished July 2026 essentially flat to modestly lower after a volatile month, snapping the S&P 500’s 11-year streak of positive Julys. The pullback followed a divided, hawkish hold by the Federal Reserve, with three regional presidents dissenting in favor of an immediate rate hike, the largest hawkish dissent since 2022–2023. The 10-year Treasury yield, which ended the month at a yield of 4.75%, pushed to a fresh 2026 high, up from 4.18% at the start of the year and 4.44% at midyear, and weighed on bonds and rate-sensitive equity sectors. Even so, the setback was minor with the S&P 500 giving up -0.06%, mitigated by resilient corporate earnings, and most major indices remain solidly positive on a trailing three-month, year-to-date, and trailing twelve-month basis. The impact on bonds was more pronounced, with the Bloomberg US Aggregate Bond Index posting a sharper than average return of -1.30%.
The dominant theme of 2026 has been a historic rotation: value, small-cap, and international stocks have decisively outpaced growth and large-cap technology, while energy and other commodity-linked cyclicals have been the year’s best-performing asset classes. Fixed income has struggled as inflation has proven sticky, driven by AI-related demand for memory chips, tariffs, and elevated oil prices, keeping the Federal Reserve on hold (and, by some dissenting voices, tilted toward hiking) even as growth data softens.
International markets turned in mixed results in July but beat out the U.S. over the trailing twelve months, aided by a broadening global recovery, a modestly weaker U.S. dollar, and lower concentration in mega-cap technology. Developed markets (MSCI EAFE) gained in July (+1.96) even as the U.S. fell, while emerging markets pulled back in July but remain one of the year’s top-performing major equity asset class. The combined developed and emerging market results produced a narrow 0.34% gain in the MSCI ACWI ex USA Index.
Labeled sustainable long-term funds posted an average decline of 1.60% in July while the same segment added an average of 16.3% over the trailing twelve months. The same relationship held for US equity and international funds recorded gains of -1.26% and -2.30% in July and an average of 21.6% and 24.81%, respectively, over the trailing twelve months.
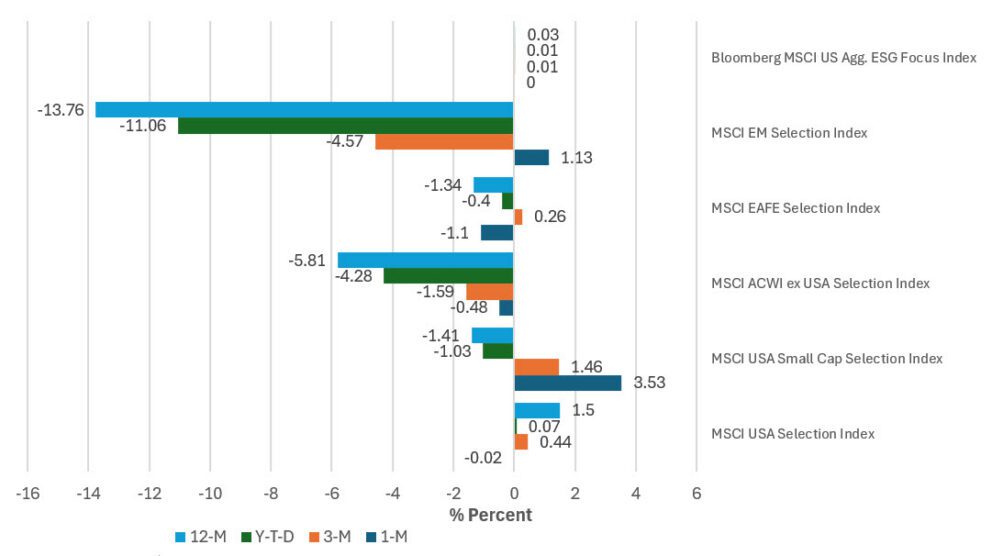
Near-term results posted by selected sustainable indices. Of six selected sustainable indices representing the performance of stocks and bonds, only one benchmark, the MSCI EAFE Selection Index, recorded a gain in July. Up 0.86%, the benchmark that tracks large and mid-cap companies across developed markets trailed its conventional parent index by 1.10%. It joined two other indices that trailed their conventional counterparts in July, including the MSCI USA Selection Index and MSCI ACWI ex USA Selection Index that lagged by 0.02% and 0.48%, respectively. Both the MSCI USA Small Cap Selection Index and the MSCI Emerging Markets Selection Index outperformed their conventional counterparts by 3.53% and 1.13%, respectively. At the same time, the Bloomberg MSCI US Aggregate ESG Index performed in line with its conventional index, the Bloomberg US Aggregate Bond Index. Both indices recorded declines of 1.10%.
Across the six indices over the trailing three months, year-to-date and twelve-month intervals, periods of relative outperformance were limited, ranging from two (most frequently) to three periods. On the negative side, wide variations arose in the performance of the MSCI Emerging Markets Selection Index (-13.76%) and the MSCI ACWI ex USA Selection Index (-5.81%).
Intermediate-to-long term results posted by sustainable indices. Through the month of July, the MSCI USA Selection Index continues to be the only yardstick of the five stock-oriented benchmarks that is posting consistent outperformance results over the three-, five- and ten-year intervals. The other four equity indices underperformed when compared to their conventional counterparts over the trailing three- five- and ten-year intervals. With regard to fixed income, the Bloomberg MSCI US Aggregate ESG Focus Index has managed to post results that are in line with the Bloomberg US Aggregate Bond Index over the short-to-intermediate term intervals that it’s been calculated, often times achieving the same results or, if they vary, the results deviate by no more than one to two basis points in either direction. At the end of July, the relative results over the trailing three- and five-year periods are either flat or positive. |