The Bottom Line: The S&P 500 Index gained 2.38% in July while selected ESG indices outperformed and sustainable fundsfocused indices turned in mixed results.
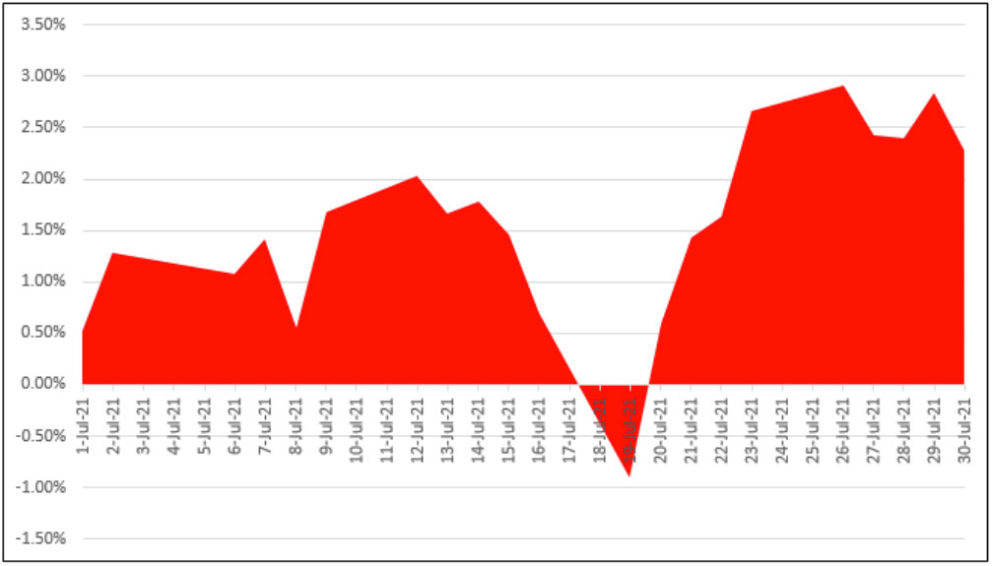
Stocks moved higher in July after giving up a month-to-date -1.59% on the S&P 500 by July 19th due to inflation concerns. Still, stocks managed to rebound over the last nine trading days of the month, adding 3.21% and closing the month of July up 2.38% on a total return basis. Refer to Chart 1. Stocks were powered by strong earnings reports (close to 90% of reporting companies beat analyst expectations) and signs that the economic rebound remained on track, but at a slower pace than in recent months. Lower expectations for economic growth, still strong but slowing relative to the initial stages of the recovery, were driven by the spread of the Delta variant of COVID-19 and a slowdown in the rate of vaccinations in the US. The Dow Jones Industrial Average (DJIA) and NASDAQ Composite were also up, 1.3% and 1.2%, respectively. Small stocks, however, didn’t perform as well. The Russell 2000 posted a -3.6% decline as the energy sector was hard hit, posting a decline of 15.4% across the small cap stock segment. The Russell 2000 remained ahead 13.3% on a year-to-date basis and up 52% over the trailing 12-months. Growth stocks outperformed value-oriented stocks while sectoral leadership varied depending upon the market segment. For example, large cap stocks in the health care sector led with an average gain of 4.9% while real estate and utilities led in the mid-cap and small cap sectors with average returns of 3.0% and 5.1%, in that order. At the same time, the energy sector trailed across the three market cap segments with average returns ranging from -6.3% for mid-caps, -8.3% for large caps and -15.4% for small caps.
Foreign stocks lagged in July. The MSCI ACWI, ex USA Index gave up -1.65% while emerging markets recorded a decline of -6.7% as China, a heavily weighted component of the index (34.6%), dropped -13.8%, in part, due to governmental scrutiny being applied to the technology sector.
US 10-year Treasury yields continue their recent decline, ending July at a yield of 1.24% versus 1.45% at the end of June. The Bloomberg Barclays US Aggregate Bond Index was up 1.12%, delivering the best monthly result since July 2020.
Chart 1: S&P 500 cumulative price performance July 2021
With one exception, selected ESG securities market indices outperformed
With one exception, selected ESG securities market indices tracking US and international market segments, including fixed income, performed well in July relative to their conventional counterpart indices. Levels of outperformance ranged from 1 bps recorded by both the Bloomberg Barclays MSCI ESG Focus US Aggregate Bond Index and the MSCI ACWI ex USA ESG Leaders Index to 24 bps achieved by the MSCI EAFE ESG Leaders Index¹ . At the same time, the MSCI Emerging Markets ESG Leaders Index lagged its conventional counterpart by 29 bps. This negative variance was likely attributable to the higher China weighting, 36.51% versus 34.62% during a month when Chinese stocks registered a decline of -13.8%, as noted above. Refer to Table 1 and Chart 2. Nearly 2X weightings relative to the conventional index in Alibaba Group Holding and Tencent Holdings that registered declines of -13.9% and -18.7% in July exacerbated the relative decline.
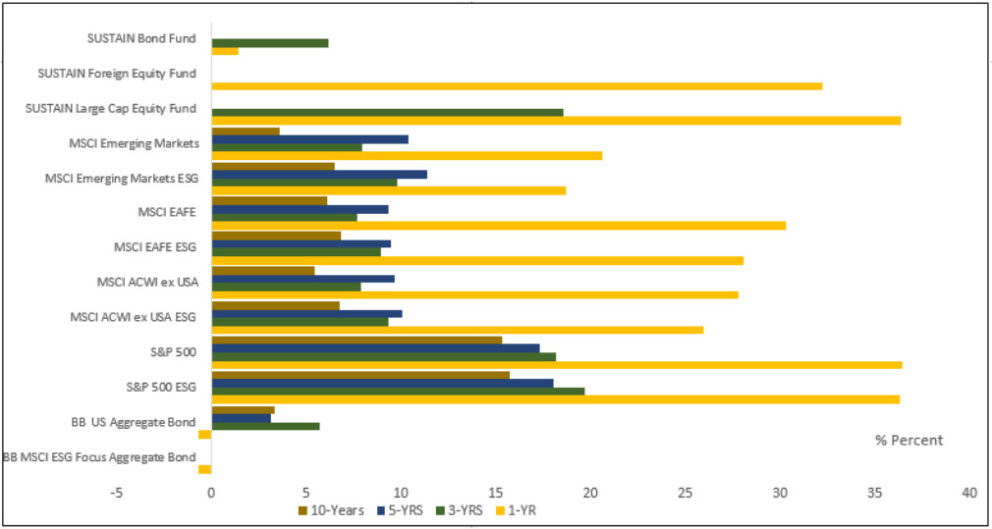
While the ESG equity indices lag over the course of the latest twelve month period, the intermediate to long-term relative performance track records achieved by ESG benchmarks (3-5 and 10-years where data is available), including the MSCI Emerging Markets ESG Leaders Index, continue along their path of outperformance.
Table 1: Selected ESG indices and total return performance results to July 2021
| Index | 1 MO (%) | 3-M (%) | 1-YR (%) | 3-YRS (%) | 5-YRS (%) | 10-Years (%) |
| Bloomberg Barclays MSCI ESG Focus Aggregate Bond Index | 1.13 | 2.18 | -0.67 | |||
| Bloomberg Barclays US Aggregate Bond Index | 1.12 | 2.16 | -0.7 | 5.73 | 3.13 | 3.35 |
| S&P 500 ESG Index | 2.44 | 5.74 | 36.31 | 19.69 | 18.05 | 15.73 |
| S&P 500 Index | 2.38 | 5.50 | 36.45 | 18.16 | 17.35 | 15.35 |
| MSCI ACWI ex USA ESG Leaders Index | -1.64 | 0.77 | 25.93 | 9.36 | 10.09 | 6.78 |
| MSCI ACWI ex USA Index | -1.65 | 0.77 | 27.78 | 7.92 | 9.65 | 5.42 |
| MSCI EAFE ESG Leaders Index | 0.99 | 3.16 | 28.06 | 8.95 | 9.49 | 6.84 |
| MSCI EAFE Index | 0.75 | 2.87 | 30.31 | 7.66 | 9.35 | 6.14 |
| MSCI Emerging Markets ESG Leaders Index | -7.02 | -4.98 | 18.69 | 9.78 | 11.4 | 6.5 |
| MSCI Emerging Markets Index | -6.73 | -4.40 | 20.64 | 7.93 | 10.37 | 3.61 |
| SUSTAIN Large Cap Equity Fund Index | 2.27 | 5.27 | 36.36 | 18.56 | ` | |
| SUSTAIN Foreign Equity Fund Index | -0.65 | 1.21 | 32.23 | |||
| SUSTAIN Bond Fund Index | 0.90 | 2.15 | 1.46 | 6.2 |
Notes of Explanation: *Gross returns; blank cells indicate that data is not available; 3-5-and 10-year returns are average annual; Sources: MSCI, S&P Global, Sustainable Research and Analysis
Chart 2: Selected ESG indices and total return performance results to July 2021
Sustainable funds indices: SUSTAIN Bond Fund Index snaps streak of outperformance
The Sustainable (SUSTAIN) Large Cap Equity Fund Index and the Sustainable (SUSTAIN) Bond Fund Index both came in behind their conventional counterpart benchmarks by 10 bps and 22 bps, respectively, while the Sustainable (SUSTAIN) Foreign Fund Index, which lagged behind last month, eclipsed the performance of the MSCI ACWI, ex US Index by 1%. The fund indices track the ten largest actively managed funds within the category that employ a sustainable investing strategy beyond absolute reliance on exclusionary practices for religious, ethical or social reasons (responsible investing). To qualify for inclusion in each index, funds in excess of $50 million in net assets must actively apply environmental, social and governance (ESG) criteria to their investment processes and decision making. In tandem with theirESG investingstrategy, funds may also employ exclusionary strategies along with impact-oriented investment approaches as well as shareholder advocacy.
Sustainable (SUSTAIN) Large Cap Equity Fund Index: +2.27%
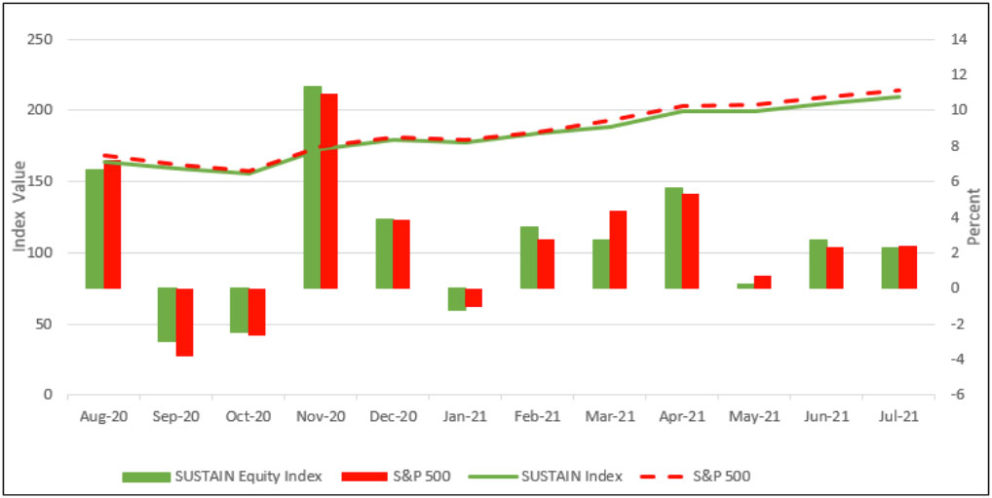
The Sustainable (SUSTAIN) Large Cap Equity Fund Index gained 2.27% in July but lagged the S&P 500 Index by 11 bps. The benchmark now trails the S&P 500 Index over the latest quarter and 12-month intervals while continuing to lead by 40 bps (annualized) for the 3-year period ended July 30st. Refer to Chart 3.
Chart 3: SUSTAIN Large Cap Equity Fund Index Performance Results: August 2020 – July 2021
Sustainable (SUSTAIN) Bond Fund Index: +0.90 bps
After registering a string of fifteen consecutive monthly returns that exceeded the performance of the Bloomberg Barclays US Aggregate Bond Index, the (SUSTAIN) Bond Fund Index lost relative ground and fell behind by 22 bps in July. The SUSTAIN Bond Fund Index gained 0.90% versus 1.12% posted by the Bloomberg Barclays US Aggregate Bond Index. As a result, theSustainable FundIndex is now behind the conventional securities market benchmark for the trailing three months but remains firmly ahead for the 1-year and 3-year intervals ending in July. Refer to Chart 4.
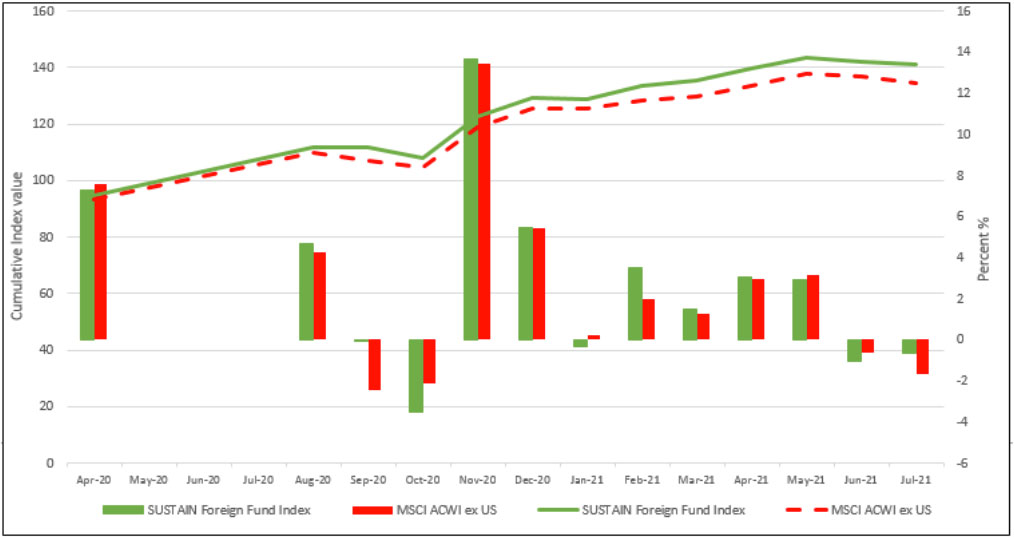
Sustainable (SUSTAIN) Foreign Fund Index: -0.65%
Posting a second consecutive monthly decline, the Sustainable (SUSTAIN) Foreign Fund Index nevertheless managed to outperform the MSCI ACWI, ex USA Index by 1% as it dropped 0.65% in July. The SUSTAIN Foreign Fund Index also remained ahead for the trailing three and 12-month intervals. Refer to Chart 5.
Chart 5: SUSTAIN Foreign Fund Index Performance Results: August 2020 – July 30, 2021
Six of eight constituent funds outperformed the MSCI ACWI, ex USA Index, led by the Morgan Stanley Institutional Advantage Fund I, up 2.32%, during a month when positive results were only recorded by three funds. Leading the rear with a total return of -2.53% was the Franklin Foreign Fund A.